Lebanese vs Immigrants from Afghanistan Female Poverty
COMPARE
Lebanese
Immigrants from Afghanistan
Female Poverty
Female Poverty Comparison
Lebanese
Immigrants from Afghanistan
13.4%
FEMALE POVERTY
55.9/ 100
METRIC RATING
169th/ 347
METRIC RANK
13.4%
FEMALE POVERTY
50.8/ 100
METRIC RATING
173rd/ 347
METRIC RANK
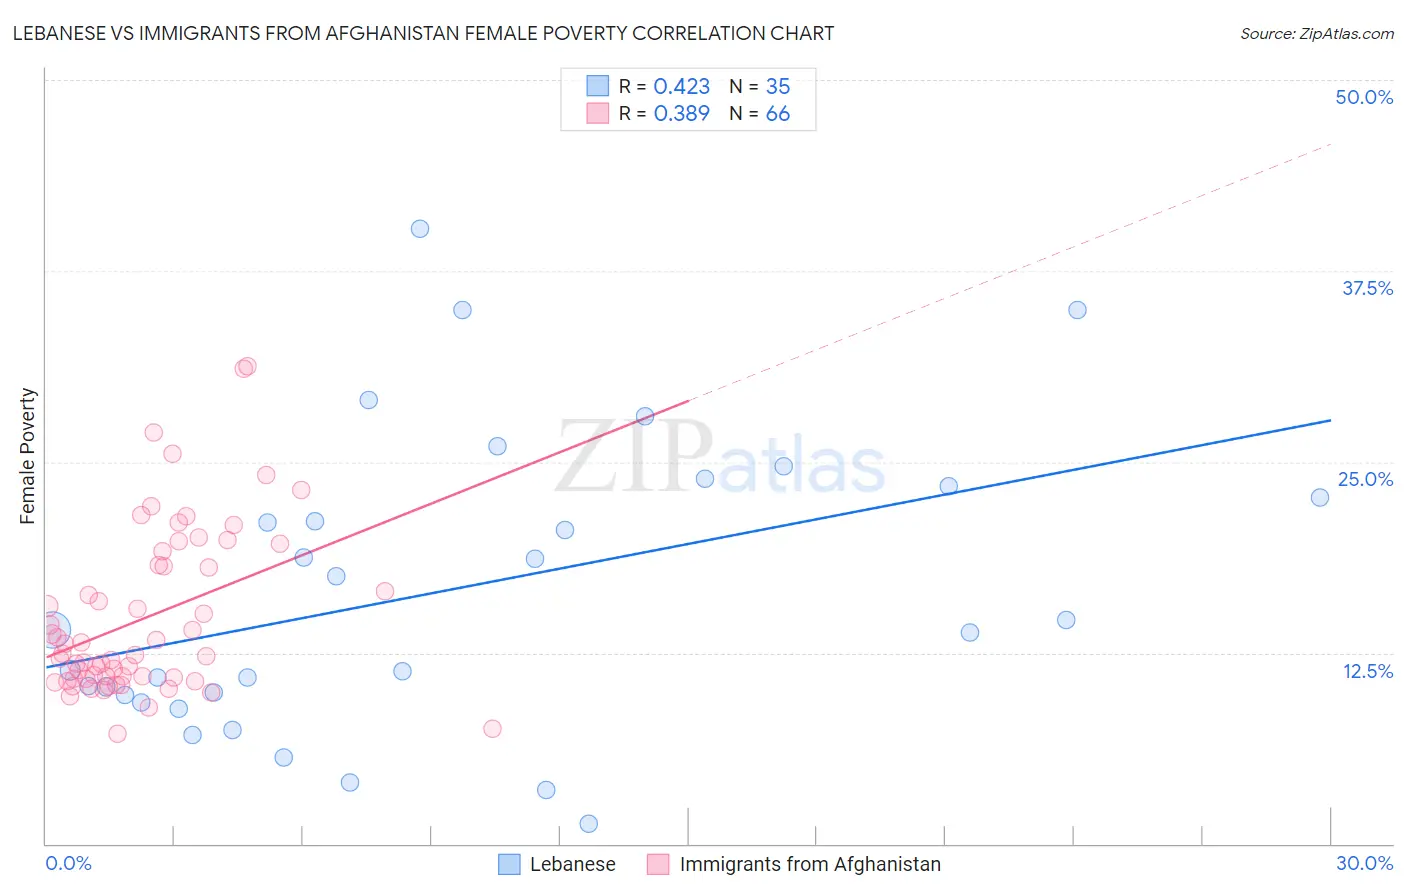
Lebanese vs Immigrants from Afghanistan Female Poverty Correlation Chart
The statistical analysis conducted on geographies consisting of 401,241,772 people shows a moderate positive correlation between the proportion of Lebanese and poverty level among females in the United States with a correlation coefficient (R) of 0.423 and weighted average of 13.4%. Similarly, the statistical analysis conducted on geographies consisting of 147,630,543 people shows a mild positive correlation between the proportion of Immigrants from Afghanistan and poverty level among females in the United States with a correlation coefficient (R) of 0.389 and weighted average of 13.4%, a difference of 0.50%.
Female Poverty Correlation Summary
| Measurement | Lebanese | Immigrants from Afghanistan |
| Minimum | 1.3% | 7.2% |
| Maximum | 40.3% | 31.3% |
| Range | 38.9% | 24.1% |
| Mean | 16.6% | 14.8% |
| Median | 14.0% | 12.4% |
| Interquartile 25% (IQ1) | 9.8% | 10.8% |
| Interquartile 75% (IQ3) | 23.4% | 18.2% |
| Interquartile Range (IQR) | 13.6% | 7.4% |
| Standard Deviation (Sample) | 9.6% | 5.5% |
| Standard Deviation (Population) | 9.5% | 5.4% |
Demographics Similar to Lebanese and Immigrants from Afghanistan by Female Poverty
In terms of female poverty, the demographic groups most similar to Lebanese are Colombian (13.4%, a difference of 0.020%), Aleut (13.4%, a difference of 0.080%), White/Caucasian (13.4%, a difference of 0.13%), Immigrants from Chile (13.3%, a difference of 0.14%), and Mongolian (13.4%, a difference of 0.23%). Similarly, the demographic groups most similar to Immigrants from Afghanistan are Immigrants from Iraq (13.4%, a difference of 0.070%), Celtic (13.4%, a difference of 0.080%), Immigrants from Spain (13.4%, a difference of 0.090%), Immigrants from Morocco (13.4%, a difference of 0.13%), and Israeli (13.5%, a difference of 0.16%).
| Demographics | Rating | Rank | Female Poverty |
| Immigrants | Ethiopia | 62.5 /100 | #161 | Good 13.3% |
| Guamanians/Chamorros | 62.4 /100 | #162 | Good 13.3% |
| Immigrants | Albania | 62.4 /100 | #163 | Good 13.3% |
| Ethiopians | 62.3 /100 | #164 | Good 13.3% |
| Scotch-Irish | 62.1 /100 | #165 | Good 13.3% |
| Immigrants | Oceania | 59.7 /100 | #166 | Average 13.3% |
| Immigrants | Chile | 57.4 /100 | #167 | Average 13.3% |
| Aleuts | 56.7 /100 | #168 | Average 13.4% |
| Lebanese | 55.9 /100 | #169 | Average 13.4% |
| Colombians | 55.7 /100 | #170 | Average 13.4% |
| Whites/Caucasians | 54.6 /100 | #171 | Average 13.4% |
| Mongolians | 53.6 /100 | #172 | Average 13.4% |
| Immigrants | Afghanistan | 50.8 /100 | #173 | Average 13.4% |
| Immigrants | Iraq | 50.0 /100 | #174 | Average 13.4% |
| Celtics | 49.9 /100 | #175 | Average 13.4% |
| Immigrants | Spain | 49.9 /100 | #176 | Average 13.4% |
| Immigrants | Morocco | 49.4 /100 | #177 | Average 13.4% |
| Israelis | 49.1 /100 | #178 | Average 13.5% |
| Immigrants | Syria | 48.8 /100 | #179 | Average 13.5% |
| South Americans | 44.8 /100 | #180 | Average 13.5% |
| Venezuelans | 44.5 /100 | #181 | Average 13.5% |