Belgian vs Puerto Rican Single Female Poverty
COMPARE
Belgian
Puerto Rican
Single Female Poverty
Single Female Poverty Comparison
Belgians
Puerto Ricans
21.5%
SINGLE FEMALE POVERTY
16.1/ 100
METRIC RATING
206th/ 347
METRIC RANK
34.1%
SINGLE FEMALE POVERTY
0.0/ 100
METRIC RATING
346th/ 347
METRIC RANK
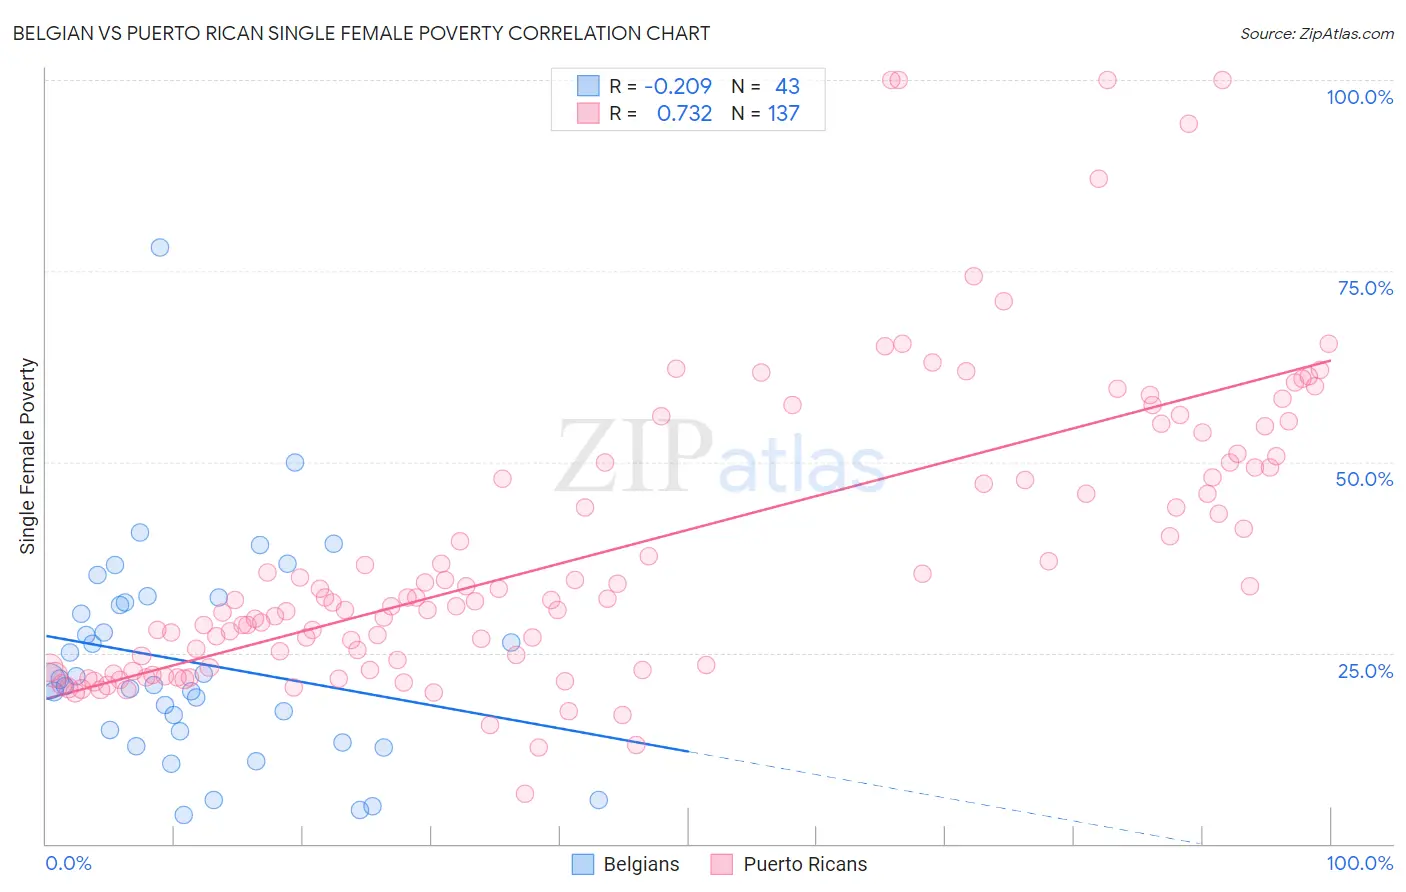
Belgian vs Puerto Rican Single Female Poverty Correlation Chart
The statistical analysis conducted on geographies consisting of 349,903,575 people shows a weak negative correlation between the proportion of Belgians and poverty level among single females in the United States with a correlation coefficient (R) of -0.209 and weighted average of 21.5%. Similarly, the statistical analysis conducted on geographies consisting of 515,297,886 people shows a strong positive correlation between the proportion of Puerto Ricans and poverty level among single females in the United States with a correlation coefficient (R) of 0.732 and weighted average of 34.1%, a difference of 58.3%.
Single Female Poverty Correlation Summary
| Measurement | Belgian | Puerto Rican |
| Minimum | 3.8% | 6.5% |
| Maximum | 78.0% | 100.0% |
| Range | 74.2% | 93.5% |
| Mean | 23.7% | 38.4% |
| Median | 21.2% | 31.9% |
| Interquartile 25% (IQ1) | 14.8% | 23.2% |
| Interquartile 75% (IQ3) | 31.6% | 49.9% |
| Interquartile Range (IQR) | 16.8% | 26.7% |
| Standard Deviation (Sample) | 13.9% | 19.4% |
| Standard Deviation (Population) | 13.7% | 19.3% |
Similar Demographics by Single Female Poverty
Demographics Similar to Belgians by Single Female Poverty
In terms of single female poverty, the demographic groups most similar to Belgians are Finnish (21.5%, a difference of 0.020%), Ghanaian (21.6%, a difference of 0.040%), Immigrants from Africa (21.5%, a difference of 0.070%), Haitian (21.6%, a difference of 0.070%), and Immigrants from Eastern Africa (21.6%, a difference of 0.11%).
| Demographics | Rating | Rank | Single Female Poverty |
| Immigrants | Immigrants | 22.0 /100 | #199 | Fair 21.4% |
| Irish | 21.4 /100 | #200 | Fair 21.4% |
| Nigerians | 20.9 /100 | #201 | Fair 21.4% |
| Immigrants | Kenya | 20.7 /100 | #202 | Fair 21.4% |
| Immigrants | Haiti | 18.8 /100 | #203 | Poor 21.5% |
| Immigrants | Africa | 16.7 /100 | #204 | Poor 21.5% |
| Finns | 16.2 /100 | #205 | Poor 21.5% |
| Belgians | 16.1 /100 | #206 | Poor 21.5% |
| Ghanaians | 15.7 /100 | #207 | Poor 21.6% |
| Haitians | 15.4 /100 | #208 | Poor 21.6% |
| Immigrants | Eastern Africa | 15.1 /100 | #209 | Poor 21.6% |
| Immigrants | Panama | 14.4 /100 | #210 | Poor 21.6% |
| Icelanders | 14.0 /100 | #211 | Poor 21.6% |
| Jamaicans | 14.0 /100 | #212 | Poor 21.6% |
| Guamanians/Chamorros | 13.7 /100 | #213 | Poor 21.6% |
Demographics Similar to Puerto Ricans by Single Female Poverty
In terms of single female poverty, the demographic groups most similar to Puerto Ricans are Tohono O'odham (34.2%, a difference of 0.30%), Houma (33.8%, a difference of 0.92%), Lumbee (33.0%, a difference of 3.3%), Crow (32.4%, a difference of 5.2%), and Navajo (31.7%, a difference of 7.7%).
| Demographics | Rating | Rank | Single Female Poverty |
| Ute | 0.0 /100 | #333 | Tragic 28.4% |
| Pueblo | 0.0 /100 | #334 | Tragic 28.6% |
| Immigrants | Yemen | 0.0 /100 | #335 | Tragic 28.9% |
| Colville | 0.0 /100 | #336 | Tragic 29.1% |
| Yuman | 0.0 /100 | #337 | Tragic 29.4% |
| Pima | 0.0 /100 | #338 | Tragic 30.3% |
| Cheyenne | 0.0 /100 | #339 | Tragic 30.4% |
| Cajuns | 0.0 /100 | #340 | Tragic 30.6% |
| Sioux | 0.0 /100 | #341 | Tragic 31.3% |
| Navajo | 0.0 /100 | #342 | Tragic 31.7% |
| Crow | 0.0 /100 | #343 | Tragic 32.4% |
| Lumbee | 0.0 /100 | #344 | Tragic 33.0% |
| Houma | 0.0 /100 | #345 | Tragic 33.8% |
| Puerto Ricans | 0.0 /100 | #346 | Tragic 34.1% |
| Tohono O'odham | 0.0 /100 | #347 | Tragic 34.2% |