Kenyan vs Immigrants from North America Unemployment Among Seniors over 75 years
COMPARE
Kenyan
Immigrants from North America
Unemployment Among Seniors over 75 years
Unemployment Among Seniors over 75 years Comparison
Kenyans
Immigrants from North America
9.1%
UNEMPLOYMENT AMONG SENIORS OVER 75 YEARS
5.4/ 100
METRIC RATING
228th/ 347
METRIC RANK
9.2%
UNEMPLOYMENT AMONG SENIORS OVER 75 YEARS
2.4/ 100
METRIC RATING
246th/ 347
METRIC RANK
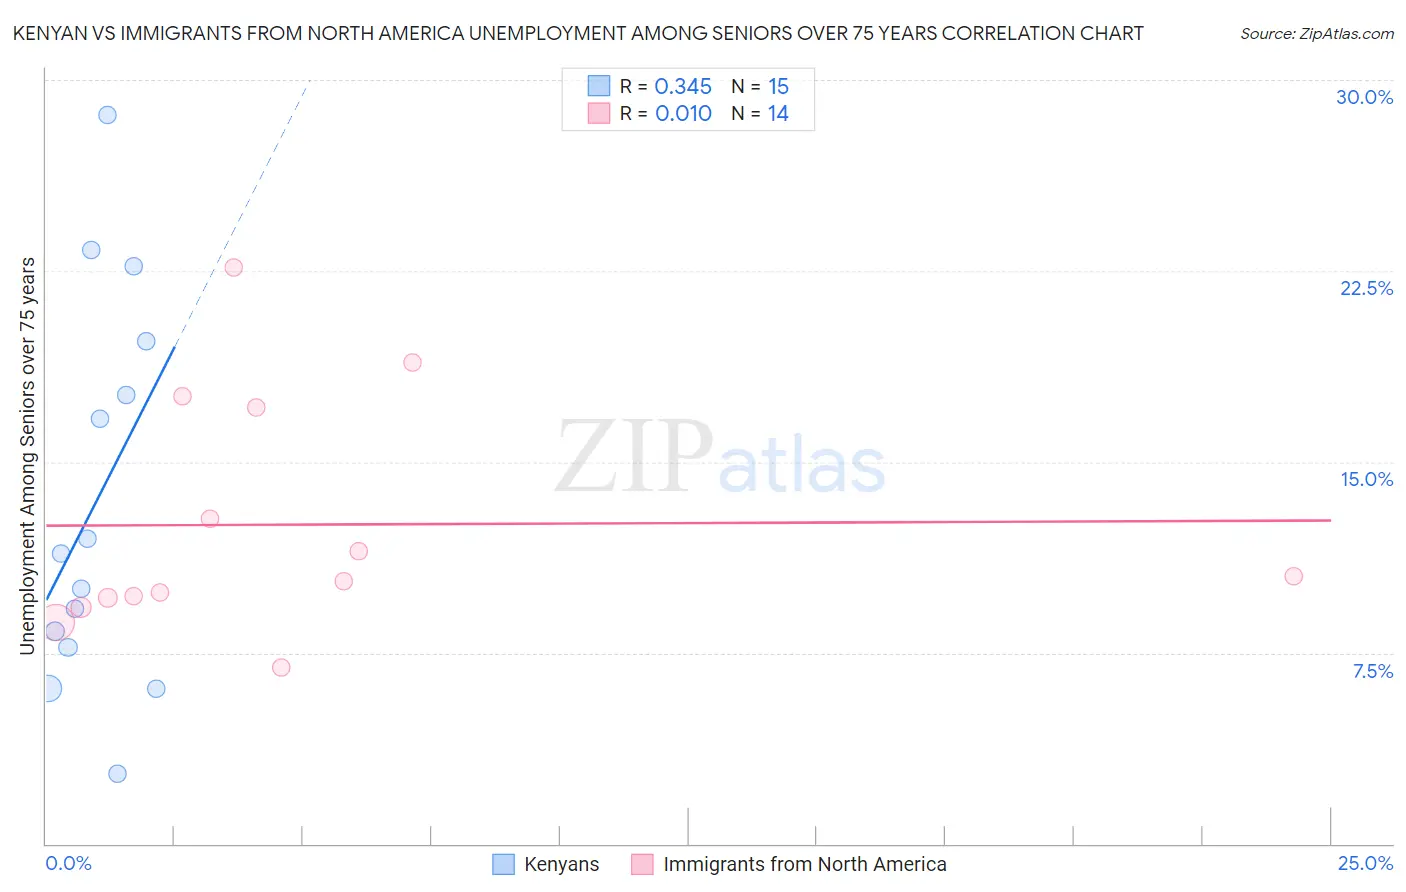
Kenyan vs Immigrants from North America Unemployment Among Seniors over 75 years Correlation Chart
The statistical analysis conducted on geographies consisting of 111,094,632 people shows a mild positive correlation between the proportion of Kenyans and unemployment rate among seniors over the age of 75 in the United States with a correlation coefficient (R) of 0.345 and weighted average of 9.1%. Similarly, the statistical analysis conducted on geographies consisting of 218,247,683 people shows no correlation between the proportion of Immigrants from North America and unemployment rate among seniors over the age of 75 in the United States with a correlation coefficient (R) of 0.010 and weighted average of 9.2%, a difference of 1.1%.
Unemployment Among Seniors over 75 years Correlation Summary
| Measurement | Kenyan | Immigrants from North America |
| Minimum | 2.8% | 6.9% |
| Maximum | 28.6% | 22.6% |
| Range | 25.8% | 15.7% |
| Mean | 13.5% | 12.5% |
| Median | 11.4% | 10.4% |
| Interquartile 25% (IQ1) | 7.7% | 9.7% |
| Interquartile 75% (IQ3) | 19.7% | 17.1% |
| Interquartile Range (IQR) | 12.0% | 7.5% |
| Standard Deviation (Sample) | 7.5% | 4.6% |
| Standard Deviation (Population) | 7.3% | 4.5% |
Demographics Similar to Kenyans and Immigrants from North America by Unemployment Among Seniors over 75 years
In terms of unemployment among seniors over 75 years, the demographic groups most similar to Kenyans are Samoan (9.1%, a difference of 0.060%), Hispanic or Latino (9.1%, a difference of 0.12%), Northern European (9.1%, a difference of 0.13%), Immigrants from Central America (9.1%, a difference of 0.13%), and African (9.1%, a difference of 0.15%). Similarly, the demographic groups most similar to Immigrants from North America are Subsaharan African (9.2%, a difference of 0.020%), Immigrants from Canada (9.2%, a difference of 0.12%), Immigrants from Germany (9.2%, a difference of 0.18%), Sierra Leonean (9.2%, a difference of 0.21%), and Slavic (9.2%, a difference of 0.21%).
| Demographics | Rating | Rank | Unemployment Among Seniors over 75 years |
| Samoans | 5.7 /100 | #227 | Tragic 9.1% |
| Kenyans | 5.4 /100 | #228 | Tragic 9.1% |
| Hispanics or Latinos | 5.0 /100 | #229 | Tragic 9.1% |
| Northern Europeans | 4.9 /100 | #230 | Tragic 9.1% |
| Immigrants | Central America | 4.9 /100 | #231 | Tragic 9.1% |
| Africans | 4.9 /100 | #232 | Tragic 9.1% |
| Yugoslavians | 4.8 /100 | #233 | Tragic 9.1% |
| Vietnamese | 4.6 /100 | #234 | Tragic 9.1% |
| Panamanians | 4.0 /100 | #235 | Tragic 9.1% |
| Jordanians | 4.0 /100 | #236 | Tragic 9.1% |
| Houma | 3.9 /100 | #237 | Tragic 9.1% |
| Inupiat | 3.6 /100 | #238 | Tragic 9.1% |
| Mexicans | 3.5 /100 | #239 | Tragic 9.1% |
| Spanish | 3.3 /100 | #240 | Tragic 9.1% |
| Immigrants | Southern Europe | 2.8 /100 | #241 | Tragic 9.2% |
| Sierra Leoneans | 2.8 /100 | #242 | Tragic 9.2% |
| Slavs | 2.8 /100 | #243 | Tragic 9.2% |
| Immigrants | Germany | 2.7 /100 | #244 | Tragic 9.2% |
| Immigrants | Canada | 2.6 /100 | #245 | Tragic 9.2% |
| Immigrants | North America | 2.4 /100 | #246 | Tragic 9.2% |
| Sub-Saharan Africans | 2.3 /100 | #247 | Tragic 9.2% |