Jordanian vs Finnish Female Poverty
COMPARE
Jordanian
Finnish
Female Poverty
Female Poverty Comparison
Jordanians
Finns
12.3%
FEMALE POVERTY
97.1/ 100
METRIC RATING
82nd/ 347
METRIC RANK
12.4%
FEMALE POVERTY
96.4/ 100
METRIC RATING
88th/ 347
METRIC RANK
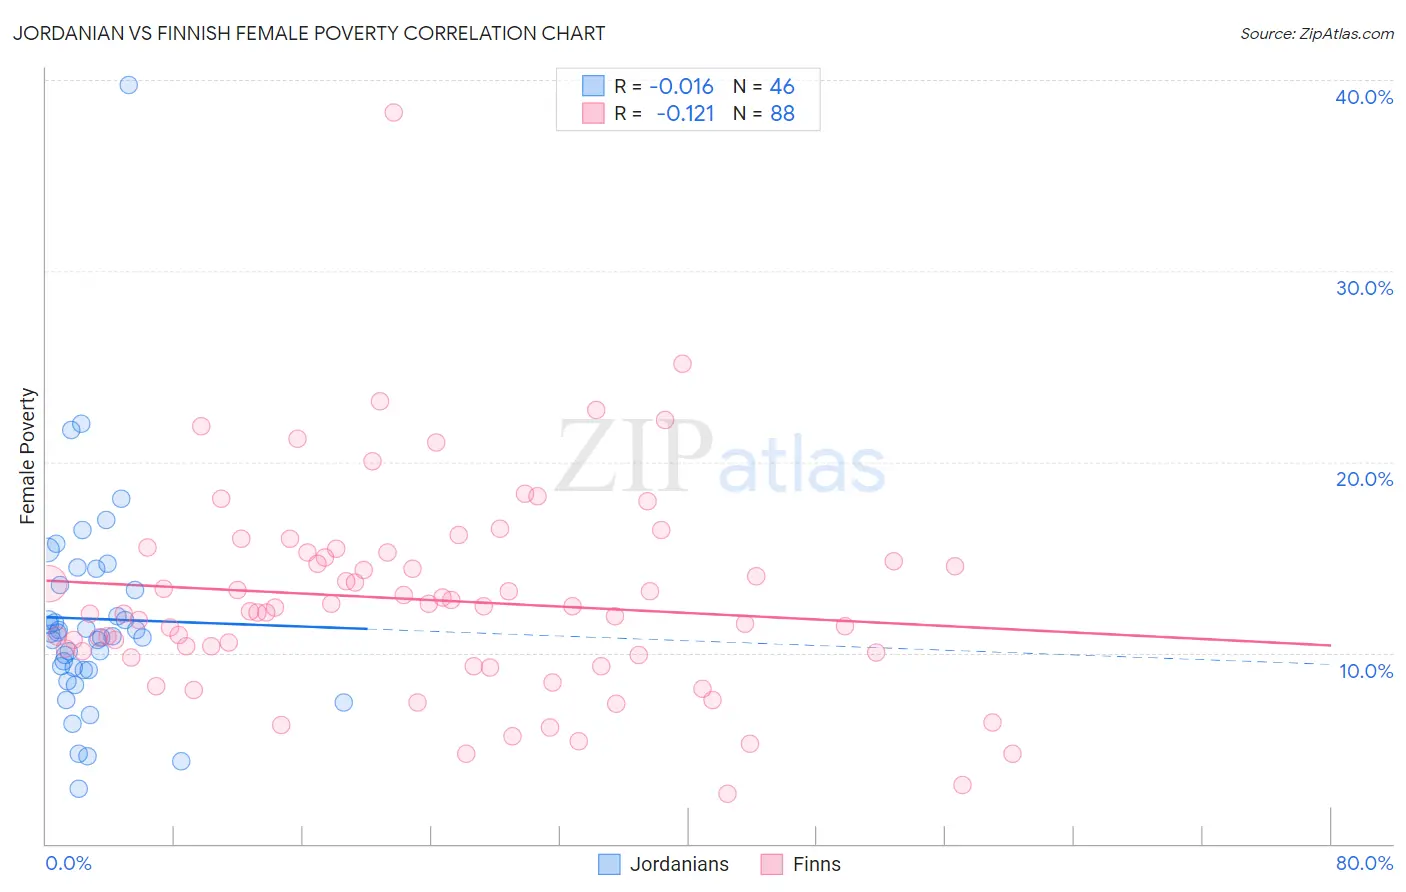
Jordanian vs Finnish Female Poverty Correlation Chart
The statistical analysis conducted on geographies consisting of 166,392,189 people shows no correlation between the proportion of Jordanians and poverty level among females in the United States with a correlation coefficient (R) of -0.016 and weighted average of 12.3%. Similarly, the statistical analysis conducted on geographies consisting of 404,419,462 people shows a poor negative correlation between the proportion of Finns and poverty level among females in the United States with a correlation coefficient (R) of -0.121 and weighted average of 12.4%, a difference of 0.56%.
Female Poverty Correlation Summary
| Measurement | Jordanian | Finnish |
| Minimum | 2.9% | 2.6% |
| Maximum | 39.7% | 38.3% |
| Range | 36.8% | 35.7% |
| Mean | 11.8% | 12.8% |
| Median | 10.9% | 12.3% |
| Interquartile 25% (IQ1) | 9.1% | 9.9% |
| Interquartile 75% (IQ3) | 13.6% | 15.1% |
| Interquartile Range (IQR) | 4.5% | 5.2% |
| Standard Deviation (Sample) | 5.8% | 5.4% |
| Standard Deviation (Population) | 5.8% | 5.3% |
Demographics Similar to Jordanians and Finns by Female Poverty
In terms of female poverty, the demographic groups most similar to Jordanians are Slovak (12.3%, a difference of 0.010%), Immigrants from Sweden (12.3%, a difference of 0.010%), Immigrants from North America (12.3%, a difference of 0.060%), Egyptian (12.3%, a difference of 0.13%), and Serbian (12.3%, a difference of 0.14%). Similarly, the demographic groups most similar to Finns are Okinawan (12.4%, a difference of 0.050%), Dutch (12.4%, a difference of 0.060%), Irish (12.4%, a difference of 0.090%), Northern European (12.4%, a difference of 0.15%), and English (12.4%, a difference of 0.20%).
| Demographics | Rating | Rank | Female Poverty |
| Europeans | 97.4 /100 | #75 | Exceptional 12.3% |
| Immigrants | Eastern Europe | 97.2 /100 | #76 | Exceptional 12.3% |
| Serbians | 97.2 /100 | #77 | Exceptional 12.3% |
| Egyptians | 97.2 /100 | #78 | Exceptional 12.3% |
| Immigrants | North America | 97.1 /100 | #79 | Exceptional 12.3% |
| Slovaks | 97.1 /100 | #80 | Exceptional 12.3% |
| Immigrants | Sweden | 97.1 /100 | #81 | Exceptional 12.3% |
| Jordanians | 97.1 /100 | #82 | Exceptional 12.3% |
| Immigrants | England | 96.9 /100 | #83 | Exceptional 12.3% |
| Northern Europeans | 96.6 /100 | #84 | Exceptional 12.4% |
| Irish | 96.5 /100 | #85 | Exceptional 12.4% |
| Dutch | 96.5 /100 | #86 | Exceptional 12.4% |
| Okinawans | 96.4 /100 | #87 | Exceptional 12.4% |
| Finns | 96.4 /100 | #88 | Exceptional 12.4% |
| English | 96.1 /100 | #89 | Exceptional 12.4% |
| Immigrants | Denmark | 95.8 /100 | #90 | Exceptional 12.4% |
| Belgians | 95.8 /100 | #91 | Exceptional 12.4% |
| Czechoslovakians | 95.7 /100 | #92 | Exceptional 12.4% |
| Immigrants | Egypt | 95.5 /100 | #93 | Exceptional 12.5% |
| Immigrants | Indonesia | 95.4 /100 | #94 | Exceptional 12.5% |
| Immigrants | South Africa | 95.4 /100 | #95 | Exceptional 12.5% |