Jordanian vs Chippewa Single Male Poverty
COMPARE
Jordanian
Chippewa
Single Male Poverty
Single Male Poverty Comparison
Jordanians
Chippewa
12.3%
SINGLE MALE POVERTY
95.9/ 100
METRIC RATING
105th/ 347
METRIC RANK
16.4%
SINGLE MALE POVERTY
0.0/ 100
METRIC RATING
319th/ 347
METRIC RANK
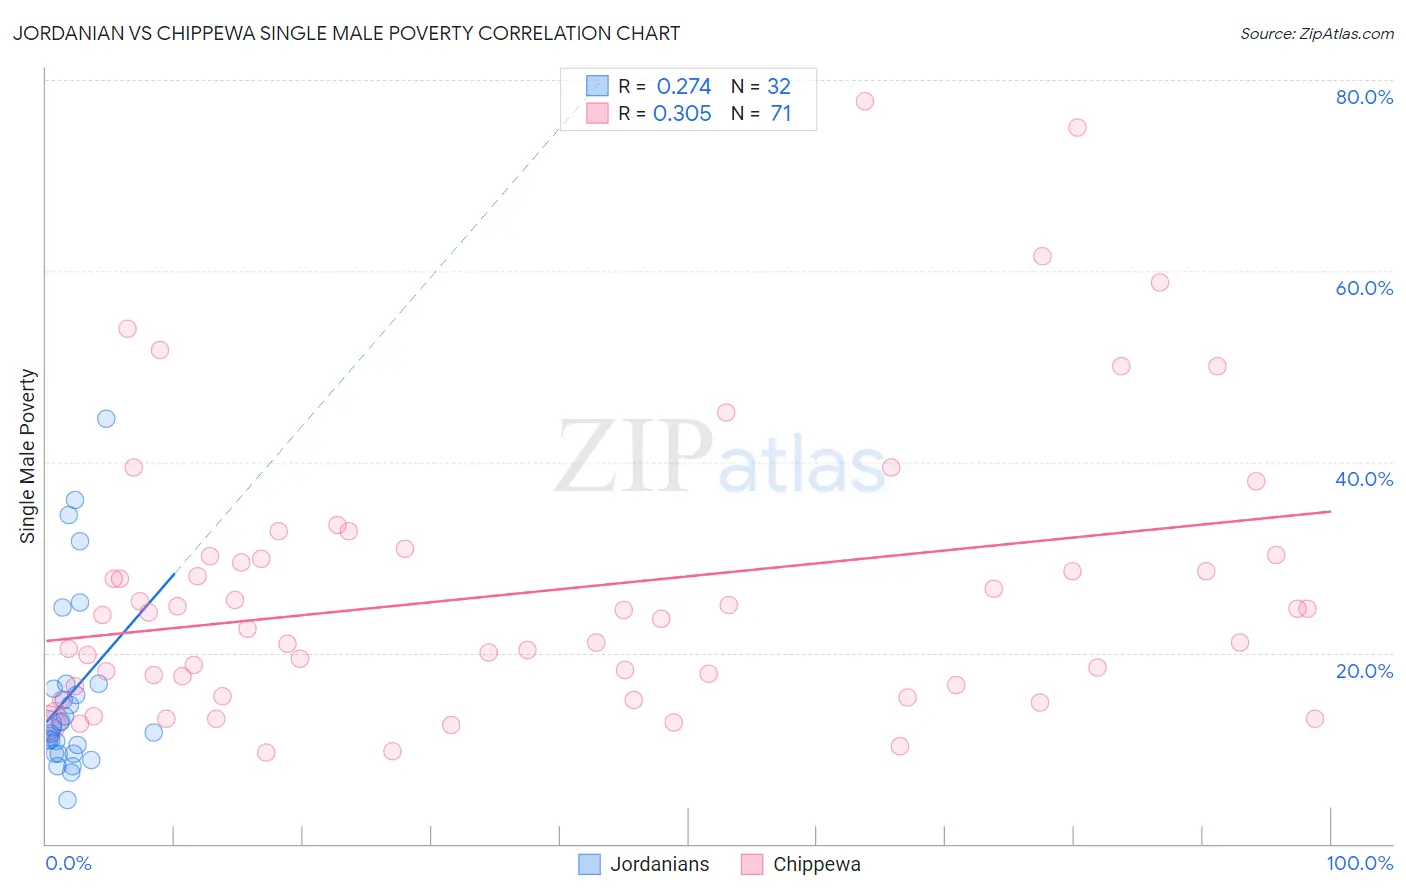
Jordanian vs Chippewa Single Male Poverty Correlation Chart
The statistical analysis conducted on geographies consisting of 156,040,584 people shows a weak positive correlation between the proportion of Jordanians and poverty level among single males in the United States with a correlation coefficient (R) of 0.274 and weighted average of 12.3%. Similarly, the statistical analysis conducted on geographies consisting of 198,626,002 people shows a mild positive correlation between the proportion of Chippewa and poverty level among single males in the United States with a correlation coefficient (R) of 0.305 and weighted average of 16.4%, a difference of 33.4%.
Single Male Poverty Correlation Summary
| Measurement | Jordanian | Chippewa |
| Minimum | 4.6% | 9.5% |
| Maximum | 44.5% | 77.8% |
| Range | 39.9% | 68.3% |
| Mean | 15.6% | 26.4% |
| Median | 12.3% | 23.6% |
| Interquartile 25% (IQ1) | 9.9% | 16.5% |
| Interquartile 75% (IQ3) | 16.5% | 30.2% |
| Interquartile Range (IQR) | 6.6% | 13.7% |
| Standard Deviation (Sample) | 9.3% | 14.6% |
| Standard Deviation (Population) | 9.2% | 14.5% |
Similar Demographics by Single Male Poverty
Demographics Similar to Jordanians by Single Male Poverty
In terms of single male poverty, the demographic groups most similar to Jordanians are Immigrants from Morocco (12.3%, a difference of 0.080%), Iraqi (12.3%, a difference of 0.26%), Immigrants from Eastern Africa (12.3%, a difference of 0.28%), Immigrants from Kazakhstan (12.2%, a difference of 0.32%), and Immigrants from Armenia (12.2%, a difference of 0.33%).
| Demographics | Rating | Rank | Single Male Poverty |
| Guamanians/Chamorros | 97.4 /100 | #98 | Exceptional 12.2% |
| Immigrants | Cuba | 97.3 /100 | #99 | Exceptional 12.2% |
| Immigrants | Australia | 97.1 /100 | #100 | Exceptional 12.2% |
| Immigrants | Latvia | 97.0 /100 | #101 | Exceptional 12.2% |
| Immigrants | Europe | 97.0 /100 | #102 | Exceptional 12.2% |
| Immigrants | Armenia | 96.7 /100 | #103 | Exceptional 12.2% |
| Immigrants | Kazakhstan | 96.7 /100 | #104 | Exceptional 12.2% |
| Jordanians | 95.9 /100 | #105 | Exceptional 12.3% |
| Immigrants | Morocco | 95.6 /100 | #106 | Exceptional 12.3% |
| Iraqis | 95.1 /100 | #107 | Exceptional 12.3% |
| Immigrants | Eastern Africa | 95.0 /100 | #108 | Exceptional 12.3% |
| Ugandans | 94.5 /100 | #109 | Exceptional 12.3% |
| Immigrants | Portugal | 93.6 /100 | #110 | Exceptional 12.3% |
| Immigrants | North Macedonia | 93.6 /100 | #111 | Exceptional 12.3% |
| Kenyans | 93.3 /100 | #112 | Exceptional 12.4% |
Demographics Similar to Chippewa by Single Male Poverty
In terms of single male poverty, the demographic groups most similar to Chippewa are Chickasaw (16.3%, a difference of 0.30%), Marshallese (16.4%, a difference of 0.48%), Osage (16.5%, a difference of 0.61%), Black/African American (16.2%, a difference of 1.1%), and Dutch West Indian (16.1%, a difference of 1.5%).
| Demographics | Rating | Rank | Single Male Poverty |
| Comanche | 0.0 /100 | #312 | Tragic 16.0% |
| Cherokee | 0.0 /100 | #313 | Tragic 16.1% |
| Alaskan Athabascans | 0.0 /100 | #314 | Tragic 16.1% |
| Cheyenne | 0.0 /100 | #315 | Tragic 16.1% |
| Dutch West Indians | 0.0 /100 | #316 | Tragic 16.1% |
| Blacks/African Americans | 0.0 /100 | #317 | Tragic 16.2% |
| Chickasaw | 0.0 /100 | #318 | Tragic 16.3% |
| Chippewa | 0.0 /100 | #319 | Tragic 16.4% |
| Marshallese | 0.0 /100 | #320 | Tragic 16.4% |
| Osage | 0.0 /100 | #321 | Tragic 16.5% |
| Shoshone | 0.0 /100 | #322 | Tragic 16.7% |
| Creek | 0.0 /100 | #323 | Tragic 16.8% |
| Immigrants | Yemen | 0.0 /100 | #324 | Tragic 16.9% |
| Choctaw | 0.0 /100 | #325 | Tragic 17.0% |
| Central American Indians | 0.0 /100 | #326 | Tragic 17.2% |