Jordanian vs Immigrants from Iraq Single Male Poverty
COMPARE
Jordanian
Immigrants from Iraq
Single Male Poverty
Single Male Poverty Comparison
Jordanians
Immigrants from Iraq
12.3%
SINGLE MALE POVERTY
95.9/ 100
METRIC RATING
105th/ 347
METRIC RANK
11.5%
SINGLE MALE POVERTY
99.9/ 100
METRIC RATING
41st/ 347
METRIC RANK
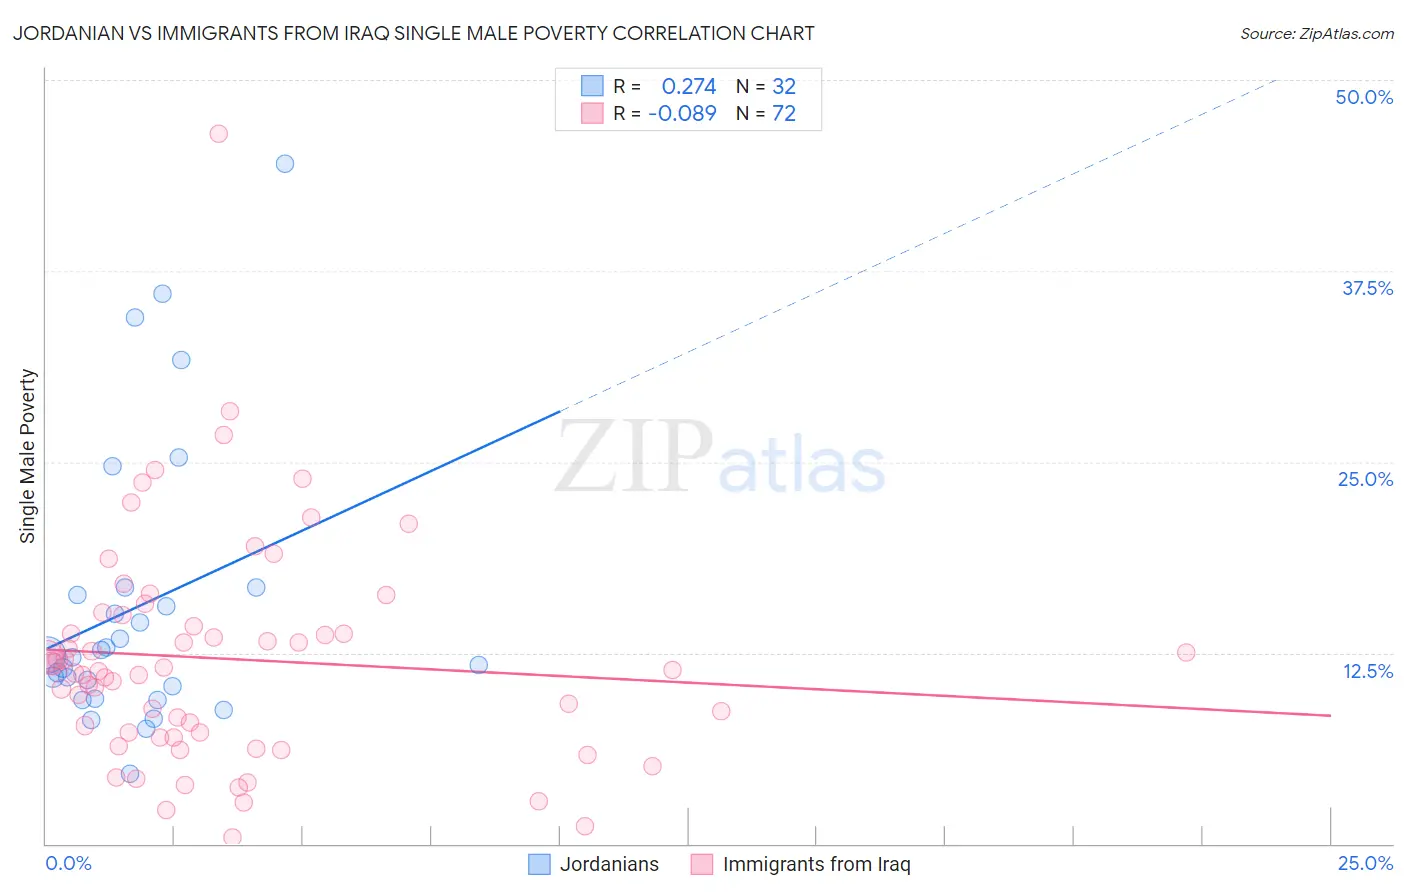
Jordanian vs Immigrants from Iraq Single Male Poverty Correlation Chart
The statistical analysis conducted on geographies consisting of 156,040,584 people shows a weak positive correlation between the proportion of Jordanians and poverty level among single males in the United States with a correlation coefficient (R) of 0.274 and weighted average of 12.3%. Similarly, the statistical analysis conducted on geographies consisting of 181,824,425 people shows a slight negative correlation between the proportion of Immigrants from Iraq and poverty level among single males in the United States with a correlation coefficient (R) of -0.089 and weighted average of 11.5%, a difference of 6.5%.
Single Male Poverty Correlation Summary
| Measurement | Jordanian | Immigrants from Iraq |
| Minimum | 4.6% | 0.42% |
| Maximum | 44.5% | 46.5% |
| Range | 39.9% | 46.1% |
| Mean | 15.6% | 12.1% |
| Median | 12.3% | 11.3% |
| Interquartile 25% (IQ1) | 9.9% | 7.1% |
| Interquartile 75% (IQ3) | 16.5% | 14.6% |
| Interquartile Range (IQR) | 6.6% | 7.5% |
| Standard Deviation (Sample) | 9.3% | 7.4% |
| Standard Deviation (Population) | 9.2% | 7.4% |
Similar Demographics by Single Male Poverty
Demographics Similar to Jordanians by Single Male Poverty
In terms of single male poverty, the demographic groups most similar to Jordanians are Immigrants from Morocco (12.3%, a difference of 0.080%), Iraqi (12.3%, a difference of 0.26%), Immigrants from Eastern Africa (12.3%, a difference of 0.28%), Immigrants from Kazakhstan (12.2%, a difference of 0.32%), and Immigrants from Armenia (12.2%, a difference of 0.33%).
| Demographics | Rating | Rank | Single Male Poverty |
| Guamanians/Chamorros | 97.4 /100 | #98 | Exceptional 12.2% |
| Immigrants | Cuba | 97.3 /100 | #99 | Exceptional 12.2% |
| Immigrants | Australia | 97.1 /100 | #100 | Exceptional 12.2% |
| Immigrants | Latvia | 97.0 /100 | #101 | Exceptional 12.2% |
| Immigrants | Europe | 97.0 /100 | #102 | Exceptional 12.2% |
| Immigrants | Armenia | 96.7 /100 | #103 | Exceptional 12.2% |
| Immigrants | Kazakhstan | 96.7 /100 | #104 | Exceptional 12.2% |
| Jordanians | 95.9 /100 | #105 | Exceptional 12.3% |
| Immigrants | Morocco | 95.6 /100 | #106 | Exceptional 12.3% |
| Iraqis | 95.1 /100 | #107 | Exceptional 12.3% |
| Immigrants | Eastern Africa | 95.0 /100 | #108 | Exceptional 12.3% |
| Ugandans | 94.5 /100 | #109 | Exceptional 12.3% |
| Immigrants | Portugal | 93.6 /100 | #110 | Exceptional 12.3% |
| Immigrants | North Macedonia | 93.6 /100 | #111 | Exceptional 12.3% |
| Kenyans | 93.3 /100 | #112 | Exceptional 12.4% |
Demographics Similar to Immigrants from Iraq by Single Male Poverty
In terms of single male poverty, the demographic groups most similar to Immigrants from Iraq are Egyptian (11.5%, a difference of 0.050%), Immigrants from Korea (11.5%, a difference of 0.15%), Immigrants from Peru (11.5%, a difference of 0.20%), Immigrants from Cameroon (11.5%, a difference of 0.22%), and Immigrants from Poland (11.5%, a difference of 0.23%).
| Demographics | Rating | Rank | Single Male Poverty |
| Immigrants | Ethiopia | 100.0 /100 | #34 | Exceptional 11.4% |
| Immigrants | South Eastern Asia | 100.0 /100 | #35 | Exceptional 11.4% |
| Immigrants | Serbia | 100.0 /100 | #36 | Exceptional 11.4% |
| Immigrants | Singapore | 100.0 /100 | #37 | Exceptional 11.4% |
| Sri Lankans | 100.0 /100 | #38 | Exceptional 11.5% |
| Soviet Union | 100.0 /100 | #39 | Exceptional 11.5% |
| Immigrants | Korea | 100.0 /100 | #40 | Exceptional 11.5% |
| Immigrants | Iraq | 99.9 /100 | #41 | Exceptional 11.5% |
| Egyptians | 99.9 /100 | #42 | Exceptional 11.5% |
| Immigrants | Peru | 99.9 /100 | #43 | Exceptional 11.5% |
| Immigrants | Cameroon | 99.9 /100 | #44 | Exceptional 11.5% |
| Immigrants | Poland | 99.9 /100 | #45 | Exceptional 11.5% |
| Immigrants | Bulgaria | 99.9 /100 | #46 | Exceptional 11.6% |
| Nepalese | 99.9 /100 | #47 | Exceptional 11.6% |
| Immigrants | Indonesia | 99.9 /100 | #48 | Exceptional 11.6% |