Jamaican vs Russian Male Disability
COMPARE
Jamaican
Russian
Male Disability
Male Disability Comparison
Jamaicans
Russians
11.5%
MALE DISABILITY
10.9/ 100
METRIC RATING
203rd/ 347
METRIC RANK
11.1%
MALE DISABILITY
69.8/ 100
METRIC RATING
156th/ 347
METRIC RANK
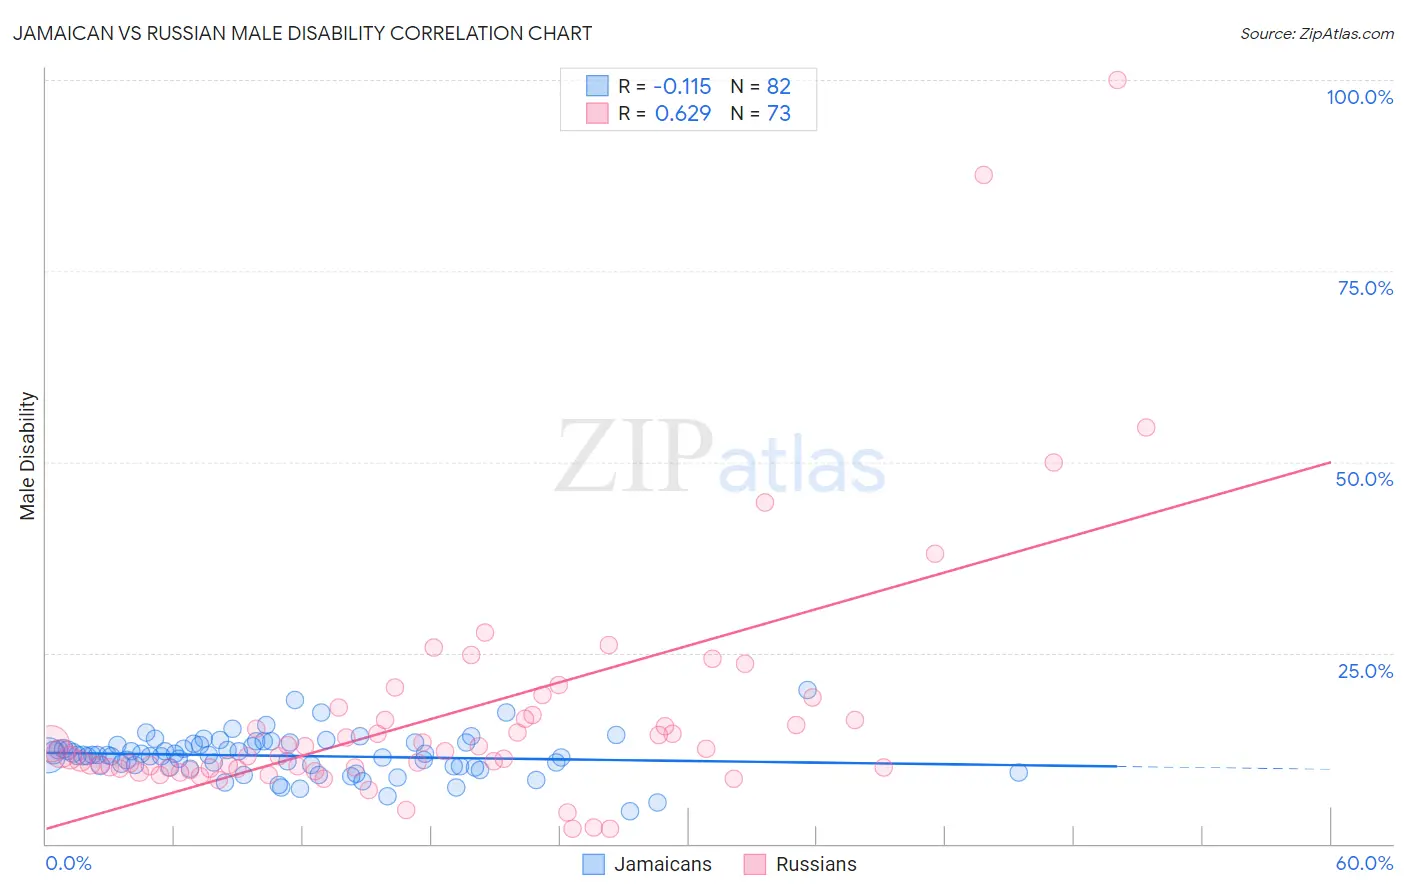
Jamaican vs Russian Male Disability Correlation Chart
The statistical analysis conducted on geographies consisting of 367,937,563 people shows a poor negative correlation between the proportion of Jamaicans and percentage of males with a disability in the United States with a correlation coefficient (R) of -0.115 and weighted average of 11.5%. Similarly, the statistical analysis conducted on geographies consisting of 512,092,434 people shows a significant positive correlation between the proportion of Russians and percentage of males with a disability in the United States with a correlation coefficient (R) of 0.629 and weighted average of 11.1%, a difference of 4.1%.
Male Disability Correlation Summary
| Measurement | Jamaican | Russian |
| Minimum | 4.2% | 2.0% |
| Maximum | 20.1% | 100.0% |
| Range | 15.9% | 98.0% |
| Mean | 11.5% | 16.8% |
| Median | 11.6% | 11.8% |
| Interquartile 25% (IQ1) | 10.2% | 9.9% |
| Interquartile 75% (IQ3) | 13.1% | 16.7% |
| Interquartile Range (IQR) | 2.9% | 6.8% |
| Standard Deviation (Sample) | 2.7% | 16.2% |
| Standard Deviation (Population) | 2.7% | 16.1% |
Similar Demographics by Male Disability
Demographics Similar to Jamaicans by Male Disability
In terms of male disability, the demographic groups most similar to Jamaicans are Immigrants from Cambodia (11.5%, a difference of 0.010%), Serbian (11.5%, a difference of 0.020%), Ukrainian (11.5%, a difference of 0.030%), Immigrants from Somalia (11.5%, a difference of 0.060%), and Icelander (11.6%, a difference of 0.10%).
| Demographics | Rating | Rank | Male Disability |
| West Indians | 18.4 /100 | #196 | Poor 11.4% |
| Somalis | 18.2 /100 | #197 | Poor 11.4% |
| Immigrants | Jamaica | 16.3 /100 | #198 | Poor 11.5% |
| Lebanese | 15.4 /100 | #199 | Poor 11.5% |
| Immigrants | Iraq | 13.0 /100 | #200 | Poor 11.5% |
| Immigrants | Panama | 13.0 /100 | #201 | Poor 11.5% |
| Immigrants | Mexico | 12.6 /100 | #202 | Poor 11.5% |
| Jamaicans | 10.9 /100 | #203 | Poor 11.5% |
| Immigrants | Cambodia | 10.8 /100 | #204 | Poor 11.5% |
| Serbians | 10.7 /100 | #205 | Poor 11.5% |
| Ukrainians | 10.6 /100 | #206 | Poor 11.5% |
| Immigrants | Somalia | 10.4 /100 | #207 | Poor 11.5% |
| Icelanders | 10.1 /100 | #208 | Poor 11.6% |
| Spanish American Indians | 10.1 /100 | #209 | Poor 11.6% |
| Ute | 9.4 /100 | #210 | Tragic 11.6% |
Demographics Similar to Russians by Male Disability
In terms of male disability, the demographic groups most similar to Russians are Immigrants from Western Africa (11.1%, a difference of 0.040%), Immigrants from Middle Africa (11.1%, a difference of 0.070%), Latvian (11.1%, a difference of 0.11%), Guatemalan (11.1%, a difference of 0.17%), and Immigrants from Moldova (11.1%, a difference of 0.21%).
| Demographics | Rating | Rank | Male Disability |
| Immigrants | Denmark | 76.4 /100 | #149 | Good 11.0% |
| Immigrants | Guatemala | 75.1 /100 | #150 | Good 11.0% |
| Cubans | 74.9 /100 | #151 | Good 11.0% |
| Immigrants | Albania | 74.4 /100 | #152 | Good 11.0% |
| Immigrants | Northern Europe | 73.2 /100 | #153 | Good 11.1% |
| Immigrants | Moldova | 72.8 /100 | #154 | Good 11.1% |
| Immigrants | Middle Africa | 70.9 /100 | #155 | Good 11.1% |
| Russians | 69.8 /100 | #156 | Good 11.1% |
| Immigrants | Western Africa | 69.2 /100 | #157 | Good 11.1% |
| Latvians | 68.1 /100 | #158 | Good 11.1% |
| Guatemalans | 67.2 /100 | #159 | Good 11.1% |
| Albanians | 66.5 /100 | #160 | Good 11.1% |
| Immigrants | West Indies | 65.7 /100 | #161 | Good 11.1% |
| Immigrants | Haiti | 65.3 /100 | #162 | Good 11.1% |
| Immigrants | Kenya | 63.8 /100 | #163 | Good 11.1% |