Iraqi vs Cajun College, 1 year or more
COMPARE
Iraqi
Cajun
College, 1 year or more
College, 1 year or more Comparison
Iraqis
Cajuns
60.7%
COLLEGE, 1 YEAR OR MORE
83.3/ 100
METRIC RATING
140th/ 347
METRIC RANK
51.2%
COLLEGE, 1 YEAR OR MORE
0.0/ 100
METRIC RATING
316th/ 347
METRIC RANK
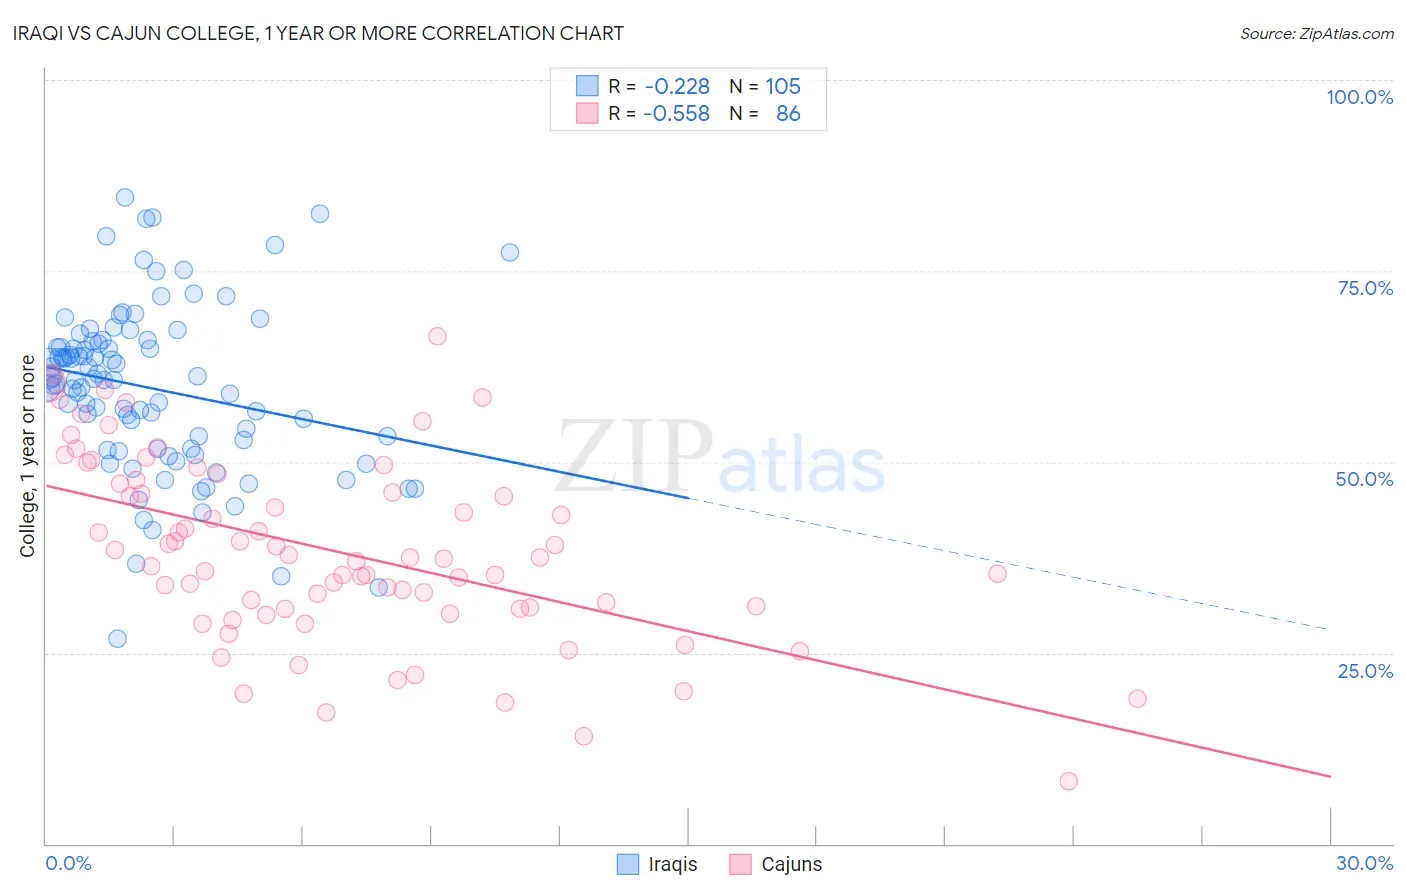
Iraqi vs Cajun College, 1 year or more Correlation Chart
The statistical analysis conducted on geographies consisting of 170,654,197 people shows a weak negative correlation between the proportion of Iraqis and percentage of population with at least college, 1 year or more education in the United States with a correlation coefficient (R) of -0.228 and weighted average of 60.7%. Similarly, the statistical analysis conducted on geographies consisting of 149,712,775 people shows a substantial negative correlation between the proportion of Cajuns and percentage of population with at least college, 1 year or more education in the United States with a correlation coefficient (R) of -0.558 and weighted average of 51.2%, a difference of 18.6%.
College, 1 year or more Correlation Summary
| Measurement | Iraqi | Cajun |
| Minimum | 26.8% | 8.2% |
| Maximum | 84.7% | 66.4% |
| Range | 57.8% | 58.2% |
| Mean | 59.6% | 38.3% |
| Median | 60.8% | 37.4% |
| Interquartile 25% (IQ1) | 51.7% | 30.8% |
| Interquartile 75% (IQ3) | 65.6% | 47.1% |
| Interquartile Range (IQR) | 13.9% | 16.3% |
| Standard Deviation (Sample) | 10.9% | 12.0% |
| Standard Deviation (Population) | 10.8% | 11.9% |
Similar Demographics by College, 1 year or more
Demographics Similar to Iraqis by College, 1 year or more
In terms of college, 1 year or more, the demographic groups most similar to Iraqis are Immigrants from Afghanistan (60.7%, a difference of 0.020%), Polish (60.7%, a difference of 0.050%), Canadian (60.6%, a difference of 0.050%), Immigrants from Eritrea (60.7%, a difference of 0.090%), and Taiwanese (60.7%, a difference of 0.10%).
| Demographics | Rating | Rank | College, 1 year or more |
| Immigrants | Uzbekistan | 88.0 /100 | #133 | Excellent 61.0% |
| Immigrants | Venezuela | 87.9 /100 | #134 | Excellent 61.0% |
| Immigrants | Uganda | 87.4 /100 | #135 | Excellent 60.9% |
| Basques | 87.2 /100 | #136 | Excellent 60.9% |
| Slovenes | 86.5 /100 | #137 | Excellent 60.9% |
| Taiwanese | 84.3 /100 | #138 | Excellent 60.7% |
| Immigrants | Eritrea | 84.3 /100 | #139 | Excellent 60.7% |
| Iraqis | 83.3 /100 | #140 | Excellent 60.7% |
| Immigrants | Afghanistan | 83.1 /100 | #141 | Excellent 60.7% |
| Poles | 82.8 /100 | #142 | Excellent 60.7% |
| Canadians | 82.7 /100 | #143 | Excellent 60.6% |
| Czechs | 81.9 /100 | #144 | Excellent 60.6% |
| Slavs | 81.1 /100 | #145 | Excellent 60.6% |
| Scottish | 80.2 /100 | #146 | Excellent 60.5% |
| Immigrants | Kenya | 79.1 /100 | #147 | Good 60.5% |
Demographics Similar to Cajuns by College, 1 year or more
In terms of college, 1 year or more, the demographic groups most similar to Cajuns are Guatemalan (51.2%, a difference of 0.070%), Hispanic or Latino (51.1%, a difference of 0.090%), Immigrants from Honduras (51.0%, a difference of 0.22%), Fijian (51.3%, a difference of 0.30%), and Immigrants from El Salvador (51.0%, a difference of 0.31%).
| Demographics | Rating | Rank | College, 1 year or more |
| Apache | 0.0 /100 | #309 | Tragic 51.8% |
| Hondurans | 0.0 /100 | #310 | Tragic 51.6% |
| Immigrants | Haiti | 0.0 /100 | #311 | Tragic 51.5% |
| Pueblo | 0.0 /100 | #312 | Tragic 51.5% |
| Immigrants | Caribbean | 0.0 /100 | #313 | Tragic 51.4% |
| Fijians | 0.0 /100 | #314 | Tragic 51.3% |
| Guatemalans | 0.0 /100 | #315 | Tragic 51.2% |
| Cajuns | 0.0 /100 | #316 | Tragic 51.2% |
| Hispanics or Latinos | 0.0 /100 | #317 | Tragic 51.1% |
| Immigrants | Honduras | 0.0 /100 | #318 | Tragic 51.0% |
| Immigrants | El Salvador | 0.0 /100 | #319 | Tragic 51.0% |
| Kiowa | 0.0 /100 | #320 | Tragic 51.0% |
| Hopi | 0.0 /100 | #321 | Tragic 50.9% |
| Navajo | 0.0 /100 | #322 | Tragic 50.8% |
| Immigrants | Guatemala | 0.0 /100 | #323 | Tragic 50.7% |