Iranian vs Yakama Single Mother Poverty
COMPARE
Iranian
Yakama
Single Mother Poverty
Single Mother Poverty Comparison
Iranians
Yakama
25.5%
SINGLE MOTHER POVERTY
100.0/ 100
METRIC RATING
11th/ 347
METRIC RANK
36.4%
SINGLE MOTHER POVERTY
0.0/ 100
METRIC RATING
327th/ 347
METRIC RANK
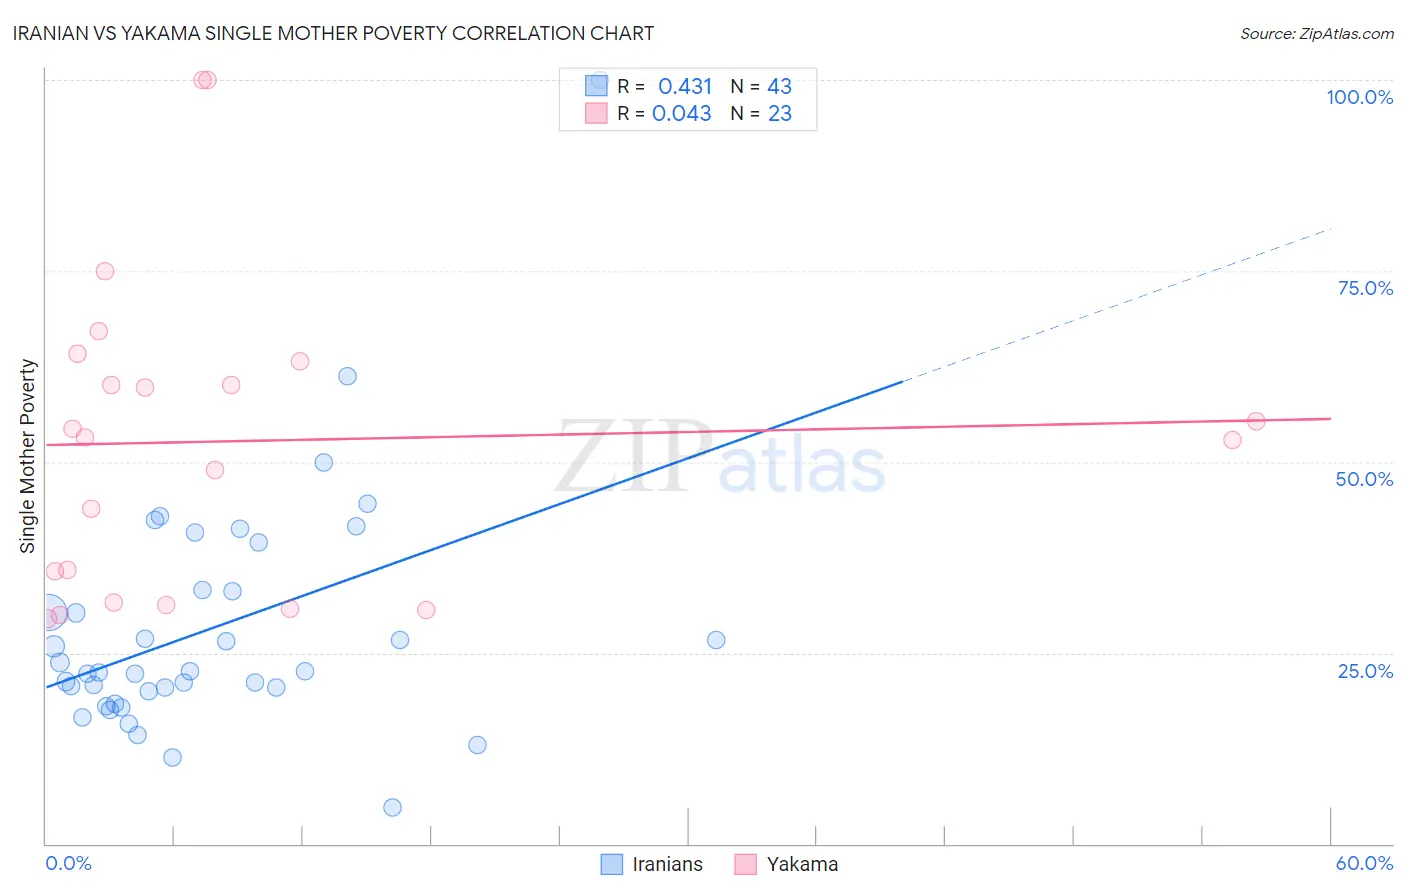
Iranian vs Yakama Single Mother Poverty Correlation Chart
The statistical analysis conducted on geographies consisting of 309,556,890 people shows a moderate positive correlation between the proportion of Iranians and poverty level among single mothers in the United States with a correlation coefficient (R) of 0.431 and weighted average of 25.5%. Similarly, the statistical analysis conducted on geographies consisting of 19,786,189 people shows no correlation between the proportion of Yakama and poverty level among single mothers in the United States with a correlation coefficient (R) of 0.043 and weighted average of 36.4%, a difference of 42.6%.
Single Mother Poverty Correlation Summary
| Measurement | Iranian | Yakama |
| Minimum | 4.7% | 29.5% |
| Maximum | 100.0% | 100.0% |
| Range | 95.3% | 70.5% |
| Mean | 28.2% | 52.7% |
| Median | 22.5% | 53.2% |
| Interquartile 25% (IQ1) | 20.0% | 31.6% |
| Interquartile 75% (IQ3) | 33.3% | 63.2% |
| Interquartile Range (IQR) | 13.2% | 31.6% |
| Standard Deviation (Sample) | 16.0% | 20.4% |
| Standard Deviation (Population) | 15.8% | 20.0% |
Similar Demographics by Single Mother Poverty
Demographics Similar to Iranians by Single Mother Poverty
In terms of single mother poverty, the demographic groups most similar to Iranians are Bhutanese (25.6%, a difference of 0.37%), Indian (Asian) (25.8%, a difference of 0.89%), Immigrants from Singapore (25.8%, a difference of 1.0%), Immigrants from South Central Asia (25.3%, a difference of 1.1%), and Immigrants from Ireland (25.8%, a difference of 1.2%).
| Demographics | Rating | Rank | Single Mother Poverty |
| Filipinos | 100.0 /100 | #4 | Exceptional 24.3% |
| Immigrants | Hong Kong | 100.0 /100 | #5 | Exceptional 24.4% |
| Thais | 100.0 /100 | #6 | Exceptional 24.5% |
| Chinese | 100.0 /100 | #7 | Exceptional 24.6% |
| Immigrants | Iran | 100.0 /100 | #8 | Exceptional 25.1% |
| Immigrants | Lithuania | 100.0 /100 | #9 | Exceptional 25.2% |
| Immigrants | South Central Asia | 100.0 /100 | #10 | Exceptional 25.3% |
| Iranians | 100.0 /100 | #11 | Exceptional 25.5% |
| Bhutanese | 100.0 /100 | #12 | Exceptional 25.6% |
| Indians (Asian) | 100.0 /100 | #13 | Exceptional 25.8% |
| Immigrants | Singapore | 100.0 /100 | #14 | Exceptional 25.8% |
| Immigrants | Ireland | 100.0 /100 | #15 | Exceptional 25.8% |
| Bolivians | 100.0 /100 | #16 | Exceptional 25.9% |
| Asians | 100.0 /100 | #17 | Exceptional 26.0% |
| Immigrants | Pakistan | 100.0 /100 | #18 | Exceptional 26.0% |
Demographics Similar to Yakama by Single Mother Poverty
In terms of single mother poverty, the demographic groups most similar to Yakama are Choctaw (36.4%, a difference of 0.060%), Apache (36.6%, a difference of 0.53%), Native/Alaskan (36.6%, a difference of 0.64%), Creek (36.7%, a difference of 0.79%), and Dutch West Indian (36.8%, a difference of 1.0%).
| Demographics | Rating | Rank | Single Mother Poverty |
| Iroquois | 0.0 /100 | #320 | Tragic 34.8% |
| Paiute | 0.0 /100 | #321 | Tragic 35.1% |
| Blacks/African Americans | 0.0 /100 | #322 | Tragic 35.2% |
| Kiowa | 0.0 /100 | #323 | Tragic 35.5% |
| Ottawa | 0.0 /100 | #324 | Tragic 35.5% |
| Ute | 0.0 /100 | #325 | Tragic 35.7% |
| Seminole | 0.0 /100 | #326 | Tragic 35.8% |
| Yakama | 0.0 /100 | #327 | Tragic 36.4% |
| Choctaw | 0.0 /100 | #328 | Tragic 36.4% |
| Apache | 0.0 /100 | #329 | Tragic 36.6% |
| Natives/Alaskans | 0.0 /100 | #330 | Tragic 36.6% |
| Creek | 0.0 /100 | #331 | Tragic 36.7% |
| Dutch West Indians | 0.0 /100 | #332 | Tragic 36.8% |
| Menominee | 0.0 /100 | #333 | Tragic 37.1% |
| Pueblo | 0.0 /100 | #334 | Tragic 37.2% |