Iranian vs Yakama 11th Grade
COMPARE
Iranian
Yakama
11th Grade
11th Grade Comparison
Iranians
Yakama
94.0%
11TH GRADE
99.9/ 100
METRIC RATING
58th/ 347
METRIC RANK
85.0%
11TH GRADE
0.0/ 100
METRIC RATING
344th/ 347
METRIC RANK
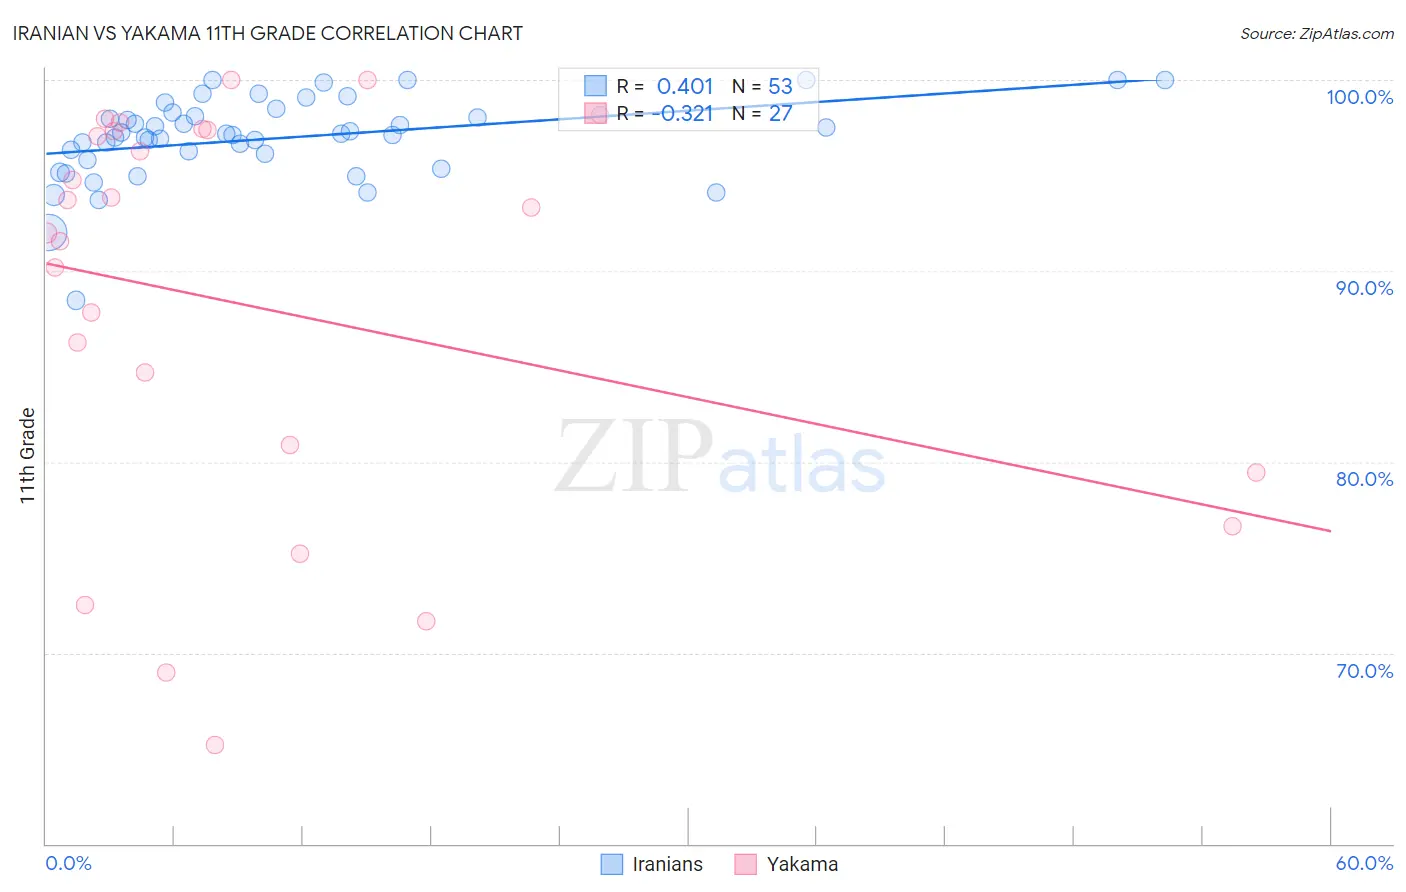
Iranian vs Yakama 11th Grade Correlation Chart
The statistical analysis conducted on geographies consisting of 316,901,778 people shows a moderate positive correlation between the proportion of Iranians and percentage of population with at least 11th grade education in the United States with a correlation coefficient (R) of 0.401 and weighted average of 94.0%. Similarly, the statistical analysis conducted on geographies consisting of 19,923,144 people shows a mild negative correlation between the proportion of Yakama and percentage of population with at least 11th grade education in the United States with a correlation coefficient (R) of -0.321 and weighted average of 85.0%, a difference of 10.6%.
11th Grade Correlation Summary
| Measurement | Iranian | Yakama |
| Minimum | 88.5% | 65.2% |
| Maximum | 100.0% | 100.0% |
| Range | 11.5% | 34.8% |
| Mean | 97.0% | 88.1% |
| Median | 97.2% | 92.0% |
| Interquartile 25% (IQ1) | 96.0% | 79.5% |
| Interquartile 75% (IQ3) | 98.2% | 97.3% |
| Interquartile Range (IQR) | 2.3% | 17.9% |
| Standard Deviation (Sample) | 2.2% | 10.5% |
| Standard Deviation (Population) | 2.2% | 10.3% |
Similar Demographics by 11th Grade
Demographics Similar to Iranians by 11th Grade
In terms of 11th grade, the demographic groups most similar to Iranians are French Canadian (94.0%, a difference of 0.0%), New Zealander (94.0%, a difference of 0.0%), Bhutanese (94.0%, a difference of 0.0%), Okinawan (94.0%, a difference of 0.0%), and Immigrants from North America (94.0%, a difference of 0.010%).
| Demographics | Rating | Rank | 11th Grade |
| Turks | 99.9 /100 | #51 | Exceptional 94.0% |
| Immigrants | Canada | 99.9 /100 | #52 | Exceptional 94.0% |
| Immigrants | Australia | 99.9 /100 | #53 | Exceptional 94.0% |
| Immigrants | North America | 99.9 /100 | #54 | Exceptional 94.0% |
| Czechoslovakians | 99.9 /100 | #55 | Exceptional 94.0% |
| French Canadians | 99.9 /100 | #56 | Exceptional 94.0% |
| New Zealanders | 99.9 /100 | #57 | Exceptional 94.0% |
| Iranians | 99.9 /100 | #58 | Exceptional 94.0% |
| Bhutanese | 99.8 /100 | #59 | Exceptional 94.0% |
| Okinawans | 99.8 /100 | #60 | Exceptional 94.0% |
| Immigrants | Belgium | 99.8 /100 | #61 | Exceptional 94.0% |
| Austrians | 99.8 /100 | #62 | Exceptional 94.0% |
| Ukrainians | 99.8 /100 | #63 | Exceptional 94.0% |
| Immigrants | Sweden | 99.8 /100 | #64 | Exceptional 93.9% |
| Native Hawaiians | 99.8 /100 | #65 | Exceptional 93.9% |
Demographics Similar to Yakama by 11th Grade
In terms of 11th grade, the demographic groups most similar to Yakama are Immigrants from Central America (84.9%, a difference of 0.030%), Spanish American Indian (84.7%, a difference of 0.27%), Immigrants from El Salvador (85.3%, a difference of 0.40%), Immigrants from Mexico (84.5%, a difference of 0.57%), and Immigrants from Guatemala (85.8%, a difference of 1.0%).
| Demographics | Rating | Rank | 11th Grade |
| Immigrants | Yemen | 0.0 /100 | #333 | Tragic 87.1% |
| Houma | 0.0 /100 | #334 | Tragic 87.0% |
| Central Americans | 0.0 /100 | #335 | Tragic 86.9% |
| Immigrants | Dominican Republic | 0.0 /100 | #336 | Tragic 86.9% |
| Immigrants | Honduras | 0.0 /100 | #337 | Tragic 86.9% |
| Immigrants | Latin America | 0.0 /100 | #338 | Tragic 86.8% |
| Guatemalans | 0.0 /100 | #339 | Tragic 86.4% |
| Salvadorans | 0.0 /100 | #340 | Tragic 86.2% |
| Mexicans | 0.0 /100 | #341 | Tragic 86.1% |
| Immigrants | Guatemala | 0.0 /100 | #342 | Tragic 85.8% |
| Immigrants | El Salvador | 0.0 /100 | #343 | Tragic 85.3% |
| Yakama | 0.0 /100 | #344 | Tragic 85.0% |
| Immigrants | Central America | 0.0 /100 | #345 | Tragic 84.9% |
| Spanish American Indians | 0.0 /100 | #346 | Tragic 84.7% |
| Immigrants | Mexico | 0.0 /100 | #347 | Tragic 84.5% |