Iranian vs South American Indian Single Mother Poverty
COMPARE
Iranian
South American Indian
Single Mother Poverty
Single Mother Poverty Comparison
Iranians
South American Indians
25.5%
SINGLE MOTHER POVERTY
100.0/ 100
METRIC RATING
11th/ 347
METRIC RANK
29.3%
SINGLE MOTHER POVERTY
43.2/ 100
METRIC RATING
178th/ 347
METRIC RANK
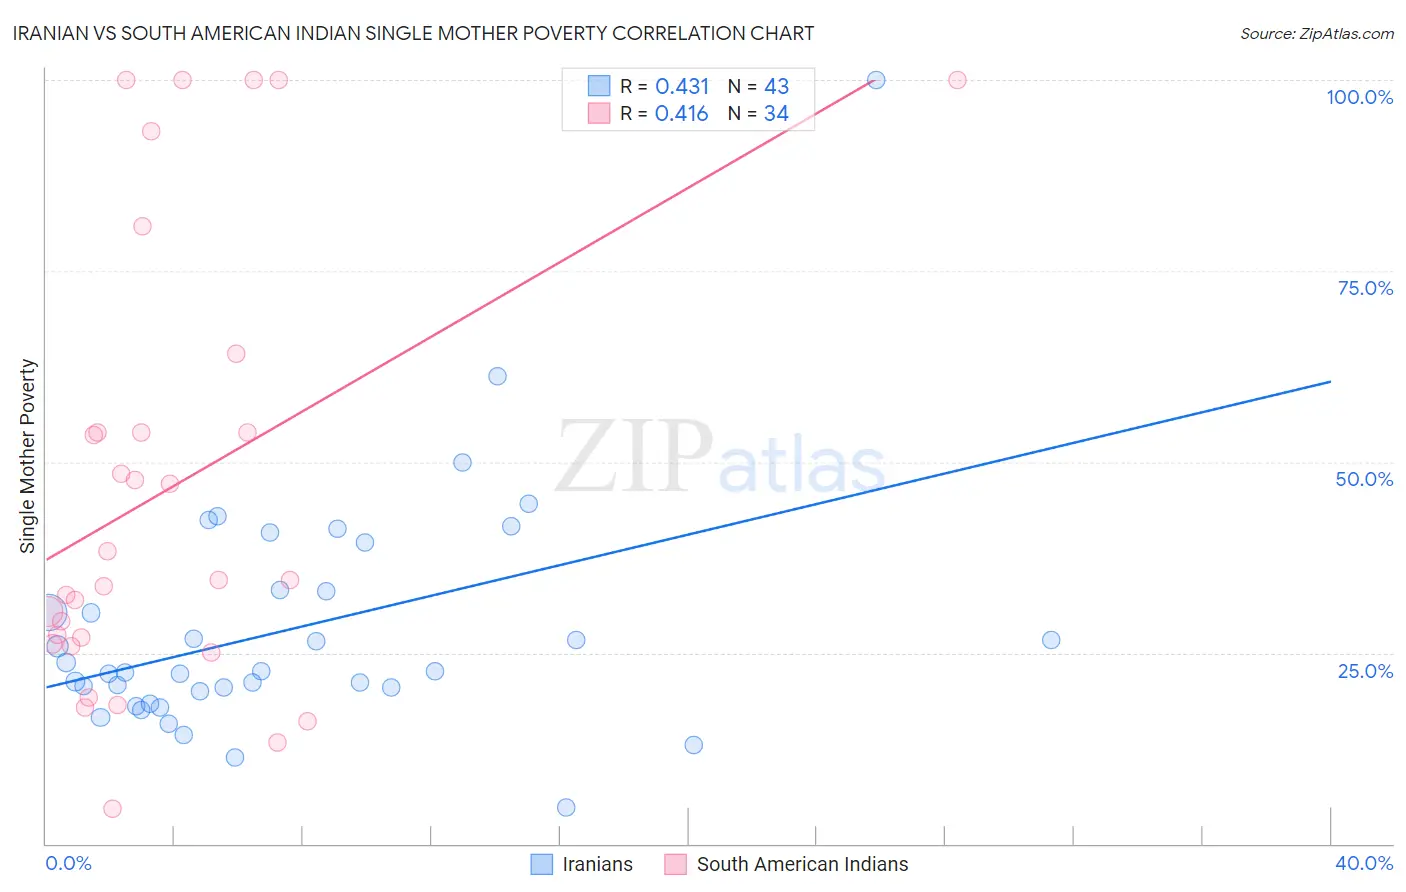
Iranian vs South American Indian Single Mother Poverty Correlation Chart
The statistical analysis conducted on geographies consisting of 309,556,890 people shows a moderate positive correlation between the proportion of Iranians and poverty level among single mothers in the United States with a correlation coefficient (R) of 0.431 and weighted average of 25.5%. Similarly, the statistical analysis conducted on geographies consisting of 163,070,605 people shows a moderate positive correlation between the proportion of South American Indians and poverty level among single mothers in the United States with a correlation coefficient (R) of 0.416 and weighted average of 29.3%, a difference of 14.6%.
Single Mother Poverty Correlation Summary
| Measurement | Iranian | South American Indian |
| Minimum | 4.7% | 4.7% |
| Maximum | 100.0% | 100.0% |
| Range | 95.3% | 95.3% |
| Mean | 28.2% | 46.5% |
| Median | 22.5% | 34.5% |
| Interquartile 25% (IQ1) | 20.0% | 26.2% |
| Interquartile 75% (IQ3) | 33.3% | 53.9% |
| Interquartile Range (IQR) | 13.2% | 27.7% |
| Standard Deviation (Sample) | 16.0% | 29.1% |
| Standard Deviation (Population) | 15.8% | 28.6% |
Similar Demographics by Single Mother Poverty
Demographics Similar to Iranians by Single Mother Poverty
In terms of single mother poverty, the demographic groups most similar to Iranians are Bhutanese (25.6%, a difference of 0.37%), Indian (Asian) (25.8%, a difference of 0.89%), Immigrants from Singapore (25.8%, a difference of 1.0%), Immigrants from South Central Asia (25.3%, a difference of 1.1%), and Immigrants from Ireland (25.8%, a difference of 1.2%).
| Demographics | Rating | Rank | Single Mother Poverty |
| Filipinos | 100.0 /100 | #4 | Exceptional 24.3% |
| Immigrants | Hong Kong | 100.0 /100 | #5 | Exceptional 24.4% |
| Thais | 100.0 /100 | #6 | Exceptional 24.5% |
| Chinese | 100.0 /100 | #7 | Exceptional 24.6% |
| Immigrants | Iran | 100.0 /100 | #8 | Exceptional 25.1% |
| Immigrants | Lithuania | 100.0 /100 | #9 | Exceptional 25.2% |
| Immigrants | South Central Asia | 100.0 /100 | #10 | Exceptional 25.3% |
| Iranians | 100.0 /100 | #11 | Exceptional 25.5% |
| Bhutanese | 100.0 /100 | #12 | Exceptional 25.6% |
| Indians (Asian) | 100.0 /100 | #13 | Exceptional 25.8% |
| Immigrants | Singapore | 100.0 /100 | #14 | Exceptional 25.8% |
| Immigrants | Ireland | 100.0 /100 | #15 | Exceptional 25.8% |
| Bolivians | 100.0 /100 | #16 | Exceptional 25.9% |
| Asians | 100.0 /100 | #17 | Exceptional 26.0% |
| Immigrants | Pakistan | 100.0 /100 | #18 | Exceptional 26.0% |
Demographics Similar to South American Indians by Single Mother Poverty
In terms of single mother poverty, the demographic groups most similar to South American Indians are Immigrants from Uzbekistan (29.3%, a difference of 0.030%), Immigrants from Bosnia and Herzegovina (29.2%, a difference of 0.090%), Immigrants from Norway (29.3%, a difference of 0.090%), Canadian (29.3%, a difference of 0.14%), and Hawaiian (29.2%, a difference of 0.22%).
| Demographics | Rating | Rank | Single Mother Poverty |
| Puget Sound Salish | 55.1 /100 | #171 | Average 29.1% |
| Carpatho Rusyns | 53.8 /100 | #172 | Average 29.1% |
| British | 50.6 /100 | #173 | Average 29.2% |
| Immigrants | Saudi Arabia | 50.0 /100 | #174 | Average 29.2% |
| Immigrants | Costa Rica | 48.8 /100 | #175 | Average 29.2% |
| Hawaiians | 47.8 /100 | #176 | Average 29.2% |
| Immigrants | Bosnia and Herzegovina | 45.1 /100 | #177 | Average 29.2% |
| South American Indians | 43.2 /100 | #178 | Average 29.3% |
| Immigrants | Uzbekistan | 42.6 /100 | #179 | Average 29.3% |
| Immigrants | Norway | 41.5 /100 | #180 | Average 29.3% |
| Canadians | 40.4 /100 | #181 | Average 29.3% |
| Immigrants | Eastern Africa | 38.5 /100 | #182 | Fair 29.3% |
| Nepalese | 38.3 /100 | #183 | Fair 29.3% |
| Nigerians | 38.0 /100 | #184 | Fair 29.3% |
| Ghanaians | 36.8 /100 | #185 | Fair 29.4% |