Iranian vs Dominican Single Mother Poverty
COMPARE
Iranian
Dominican
Single Mother Poverty
Single Mother Poverty Comparison
Iranians
Dominicans
25.5%
SINGLE MOTHER POVERTY
100.0/ 100
METRIC RATING
11th/ 347
METRIC RANK
34.5%
SINGLE MOTHER POVERTY
0.0/ 100
METRIC RATING
316th/ 347
METRIC RANK
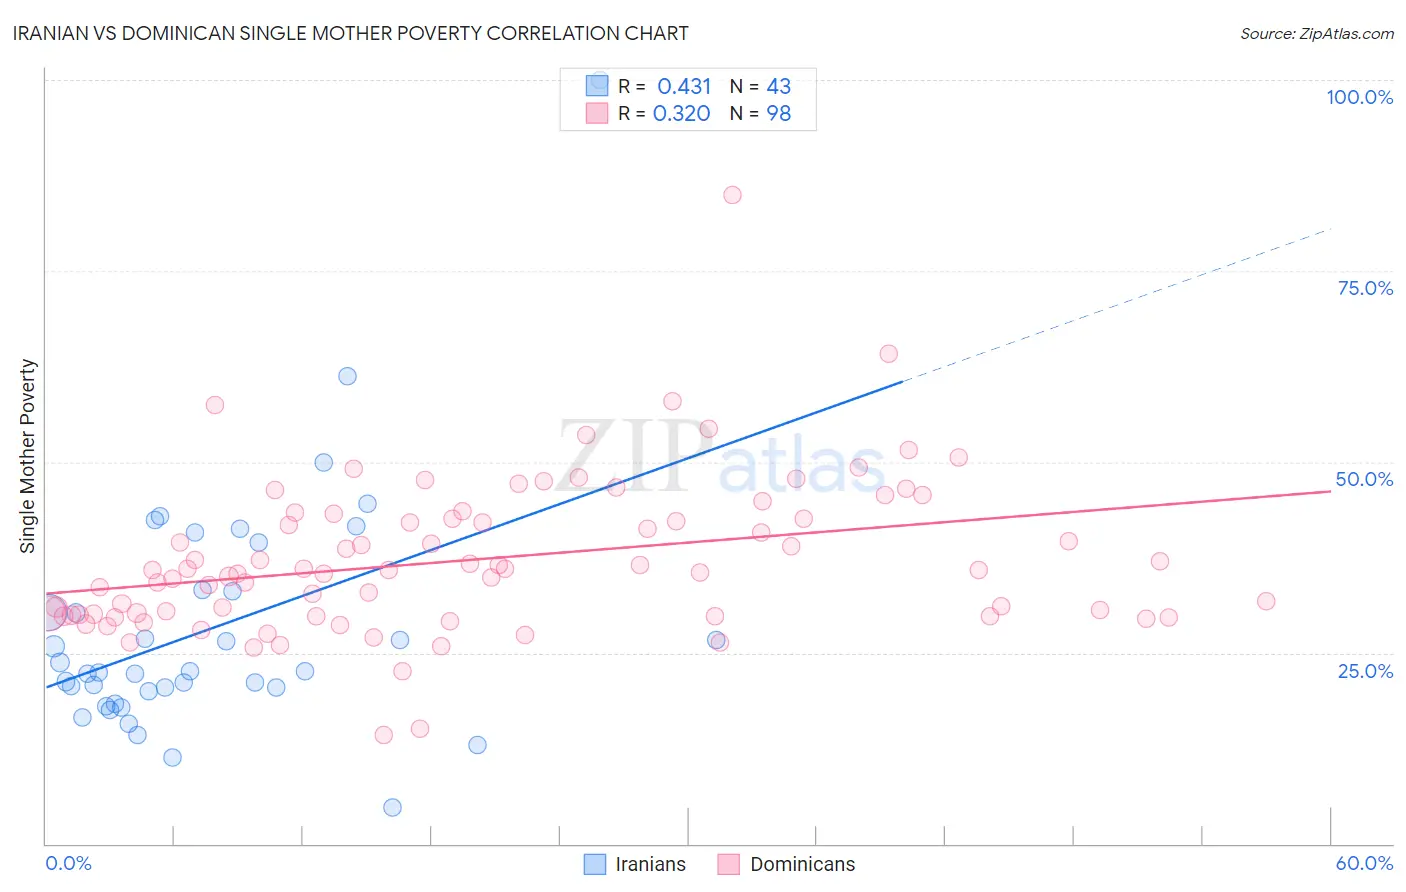
Iranian vs Dominican Single Mother Poverty Correlation Chart
The statistical analysis conducted on geographies consisting of 309,556,890 people shows a moderate positive correlation between the proportion of Iranians and poverty level among single mothers in the United States with a correlation coefficient (R) of 0.431 and weighted average of 25.5%. Similarly, the statistical analysis conducted on geographies consisting of 347,165,672 people shows a mild positive correlation between the proportion of Dominicans and poverty level among single mothers in the United States with a correlation coefficient (R) of 0.320 and weighted average of 34.5%, a difference of 35.1%.
Single Mother Poverty Correlation Summary
| Measurement | Iranian | Dominican |
| Minimum | 4.7% | 14.2% |
| Maximum | 100.0% | 84.9% |
| Range | 95.3% | 70.7% |
| Mean | 28.2% | 37.2% |
| Median | 22.5% | 35.8% |
| Interquartile 25% (IQ1) | 20.0% | 30.0% |
| Interquartile 75% (IQ3) | 33.3% | 42.5% |
| Interquartile Range (IQR) | 13.2% | 12.6% |
| Standard Deviation (Sample) | 16.0% | 10.2% |
| Standard Deviation (Population) | 15.8% | 10.1% |
Similar Demographics by Single Mother Poverty
Demographics Similar to Iranians by Single Mother Poverty
In terms of single mother poverty, the demographic groups most similar to Iranians are Bhutanese (25.6%, a difference of 0.37%), Indian (Asian) (25.8%, a difference of 0.89%), Immigrants from Singapore (25.8%, a difference of 1.0%), Immigrants from South Central Asia (25.3%, a difference of 1.1%), and Immigrants from Ireland (25.8%, a difference of 1.2%).
| Demographics | Rating | Rank | Single Mother Poverty |
| Filipinos | 100.0 /100 | #4 | Exceptional 24.3% |
| Immigrants | Hong Kong | 100.0 /100 | #5 | Exceptional 24.4% |
| Thais | 100.0 /100 | #6 | Exceptional 24.5% |
| Chinese | 100.0 /100 | #7 | Exceptional 24.6% |
| Immigrants | Iran | 100.0 /100 | #8 | Exceptional 25.1% |
| Immigrants | Lithuania | 100.0 /100 | #9 | Exceptional 25.2% |
| Immigrants | South Central Asia | 100.0 /100 | #10 | Exceptional 25.3% |
| Iranians | 100.0 /100 | #11 | Exceptional 25.5% |
| Bhutanese | 100.0 /100 | #12 | Exceptional 25.6% |
| Indians (Asian) | 100.0 /100 | #13 | Exceptional 25.8% |
| Immigrants | Singapore | 100.0 /100 | #14 | Exceptional 25.8% |
| Immigrants | Ireland | 100.0 /100 | #15 | Exceptional 25.8% |
| Bolivians | 100.0 /100 | #16 | Exceptional 25.9% |
| Asians | 100.0 /100 | #17 | Exceptional 26.0% |
| Immigrants | Pakistan | 100.0 /100 | #18 | Exceptional 26.0% |
Demographics Similar to Dominicans by Single Mother Poverty
In terms of single mother poverty, the demographic groups most similar to Dominicans are Cherokee (34.5%, a difference of 0.11%), Hopi (34.5%, a difference of 0.12%), Chickasaw (34.4%, a difference of 0.20%), Immigrants from Dominican Republic (34.4%, a difference of 0.37%), and Central American Indian (34.3%, a difference of 0.45%).
| Demographics | Rating | Rank | Single Mother Poverty |
| Potawatomi | 0.0 /100 | #309 | Tragic 34.1% |
| Hondurans | 0.0 /100 | #310 | Tragic 34.2% |
| Alsatians | 0.0 /100 | #311 | Tragic 34.3% |
| Central American Indians | 0.0 /100 | #312 | Tragic 34.3% |
| Immigrants | Dominican Republic | 0.0 /100 | #313 | Tragic 34.4% |
| Chickasaw | 0.0 /100 | #314 | Tragic 34.4% |
| Hopi | 0.0 /100 | #315 | Tragic 34.5% |
| Dominicans | 0.0 /100 | #316 | Tragic 34.5% |
| Cherokee | 0.0 /100 | #317 | Tragic 34.5% |
| Immigrants | Honduras | 0.0 /100 | #318 | Tragic 34.7% |
| Chippewa | 0.0 /100 | #319 | Tragic 34.8% |
| Iroquois | 0.0 /100 | #320 | Tragic 34.8% |
| Paiute | 0.0 /100 | #321 | Tragic 35.1% |
| Blacks/African Americans | 0.0 /100 | #322 | Tragic 35.2% |
| Kiowa | 0.0 /100 | #323 | Tragic 35.5% |