Iranian vs Immigrants from Lebanon Single Mother Poverty
COMPARE
Iranian
Immigrants from Lebanon
Single Mother Poverty
Single Mother Poverty Comparison
Iranians
Immigrants from Lebanon
25.5%
SINGLE MOTHER POVERTY
100.0/ 100
METRIC RATING
11th/ 347
METRIC RANK
28.6%
SINGLE MOTHER POVERTY
85.3/ 100
METRIC RATING
147th/ 347
METRIC RANK
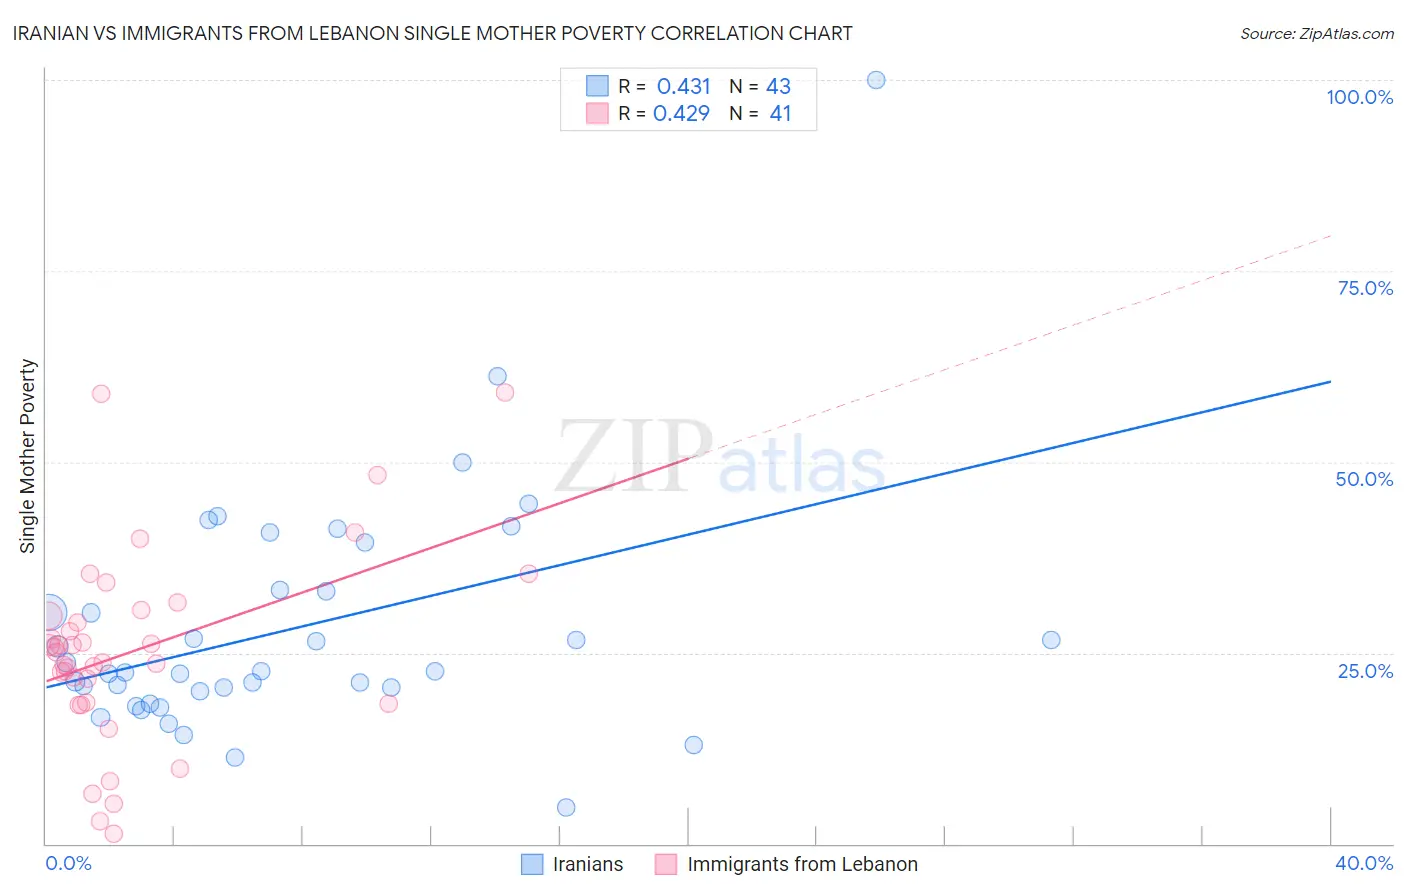
Iranian vs Immigrants from Lebanon Single Mother Poverty Correlation Chart
The statistical analysis conducted on geographies consisting of 309,556,890 people shows a moderate positive correlation between the proportion of Iranians and poverty level among single mothers in the United States with a correlation coefficient (R) of 0.431 and weighted average of 25.5%. Similarly, the statistical analysis conducted on geographies consisting of 213,301,083 people shows a moderate positive correlation between the proportion of Immigrants from Lebanon and poverty level among single mothers in the United States with a correlation coefficient (R) of 0.429 and weighted average of 28.6%, a difference of 11.9%.
Single Mother Poverty Correlation Summary
| Measurement | Iranian | Immigrants from Lebanon |
| Minimum | 4.7% | 1.4% |
| Maximum | 100.0% | 59.0% |
| Range | 95.3% | 57.6% |
| Mean | 28.2% | 25.3% |
| Median | 22.5% | 25.1% |
| Interquartile 25% (IQ1) | 20.0% | 18.4% |
| Interquartile 75% (IQ3) | 33.3% | 30.2% |
| Interquartile Range (IQR) | 13.2% | 11.8% |
| Standard Deviation (Sample) | 16.0% | 12.6% |
| Standard Deviation (Population) | 15.8% | 12.5% |
Similar Demographics by Single Mother Poverty
Demographics Similar to Iranians by Single Mother Poverty
In terms of single mother poverty, the demographic groups most similar to Iranians are Bhutanese (25.6%, a difference of 0.37%), Indian (Asian) (25.8%, a difference of 0.89%), Immigrants from Singapore (25.8%, a difference of 1.0%), Immigrants from South Central Asia (25.3%, a difference of 1.1%), and Immigrants from Ireland (25.8%, a difference of 1.2%).
| Demographics | Rating | Rank | Single Mother Poverty |
| Filipinos | 100.0 /100 | #4 | Exceptional 24.3% |
| Immigrants | Hong Kong | 100.0 /100 | #5 | Exceptional 24.4% |
| Thais | 100.0 /100 | #6 | Exceptional 24.5% |
| Chinese | 100.0 /100 | #7 | Exceptional 24.6% |
| Immigrants | Iran | 100.0 /100 | #8 | Exceptional 25.1% |
| Immigrants | Lithuania | 100.0 /100 | #9 | Exceptional 25.2% |
| Immigrants | South Central Asia | 100.0 /100 | #10 | Exceptional 25.3% |
| Iranians | 100.0 /100 | #11 | Exceptional 25.5% |
| Bhutanese | 100.0 /100 | #12 | Exceptional 25.6% |
| Indians (Asian) | 100.0 /100 | #13 | Exceptional 25.8% |
| Immigrants | Singapore | 100.0 /100 | #14 | Exceptional 25.8% |
| Immigrants | Ireland | 100.0 /100 | #15 | Exceptional 25.8% |
| Bolivians | 100.0 /100 | #16 | Exceptional 25.9% |
| Asians | 100.0 /100 | #17 | Exceptional 26.0% |
| Immigrants | Pakistan | 100.0 /100 | #18 | Exceptional 26.0% |
Demographics Similar to Immigrants from Lebanon by Single Mother Poverty
In terms of single mother poverty, the demographic groups most similar to Immigrants from Lebanon are Syrian (28.6%, a difference of 0.010%), Serbian (28.6%, a difference of 0.030%), Immigrants from Denmark (28.5%, a difference of 0.070%), Immigrants from South America (28.5%, a difference of 0.080%), and Luxembourger (28.5%, a difference of 0.11%).
| Demographics | Rating | Rank | Single Mother Poverty |
| Immigrants | Colombia | 88.0 /100 | #140 | Excellent 28.5% |
| Danes | 87.1 /100 | #141 | Excellent 28.5% |
| South Africans | 86.6 /100 | #142 | Excellent 28.5% |
| Immigrants | North America | 86.5 /100 | #143 | Excellent 28.5% |
| Luxembourgers | 86.4 /100 | #144 | Excellent 28.5% |
| Immigrants | South America | 86.1 /100 | #145 | Excellent 28.5% |
| Immigrants | Denmark | 86.1 /100 | #146 | Excellent 28.5% |
| Immigrants | Lebanon | 85.3 /100 | #147 | Excellent 28.6% |
| Syrians | 85.3 /100 | #148 | Excellent 28.6% |
| Serbians | 85.0 /100 | #149 | Excellent 28.6% |
| Northern Europeans | 81.7 /100 | #150 | Excellent 28.6% |
| Immigrants | Oceania | 79.9 /100 | #151 | Good 28.7% |
| Austrians | 79.0 /100 | #152 | Good 28.7% |
| Slovenes | 76.4 /100 | #153 | Good 28.8% |
| Portuguese | 73.2 /100 | #154 | Good 28.8% |