Iranian vs Immigrants from Cambodia Single Mother Poverty
COMPARE
Iranian
Immigrants from Cambodia
Single Mother Poverty
Single Mother Poverty Comparison
Iranians
Immigrants from Cambodia
25.5%
SINGLE MOTHER POVERTY
100.0/ 100
METRIC RATING
11th/ 347
METRIC RANK
28.9%
SINGLE MOTHER POVERTY
66.6/ 100
METRIC RATING
161st/ 347
METRIC RANK
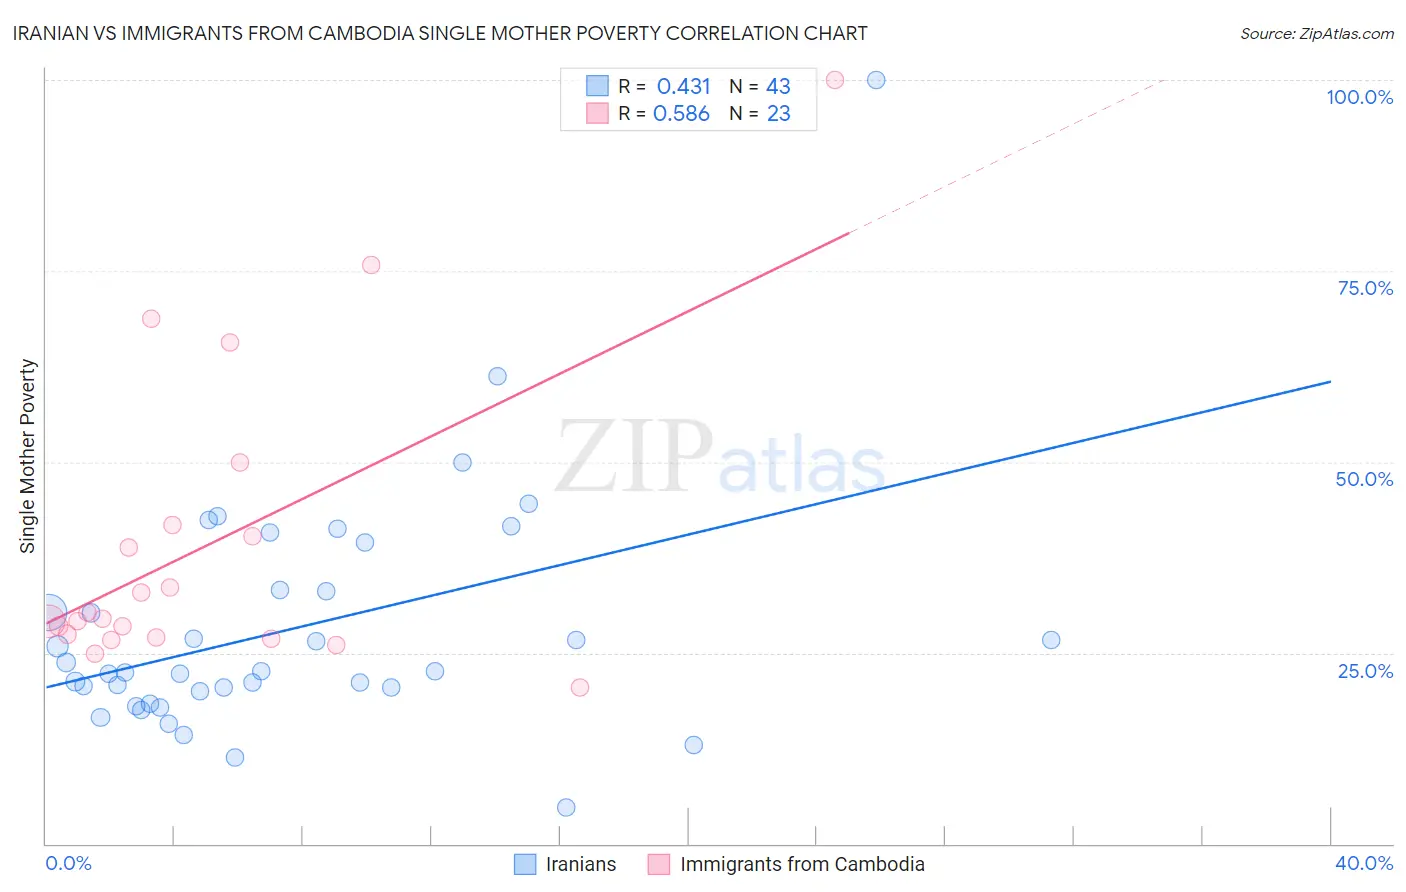
Iranian vs Immigrants from Cambodia Single Mother Poverty Correlation Chart
The statistical analysis conducted on geographies consisting of 309,556,890 people shows a moderate positive correlation between the proportion of Iranians and poverty level among single mothers in the United States with a correlation coefficient (R) of 0.431 and weighted average of 25.5%. Similarly, the statistical analysis conducted on geographies consisting of 203,469,130 people shows a substantial positive correlation between the proportion of Immigrants from Cambodia and poverty level among single mothers in the United States with a correlation coefficient (R) of 0.586 and weighted average of 28.9%, a difference of 13.3%.
Single Mother Poverty Correlation Summary
| Measurement | Iranian | Immigrants from Cambodia |
| Minimum | 4.7% | 20.4% |
| Maximum | 100.0% | 100.0% |
| Range | 95.3% | 79.6% |
| Mean | 28.2% | 39.2% |
| Median | 22.5% | 29.5% |
| Interquartile 25% (IQ1) | 20.0% | 27.0% |
| Interquartile 75% (IQ3) | 33.3% | 41.7% |
| Interquartile Range (IQR) | 13.2% | 14.7% |
| Standard Deviation (Sample) | 16.0% | 19.9% |
| Standard Deviation (Population) | 15.8% | 19.5% |
Similar Demographics by Single Mother Poverty
Demographics Similar to Iranians by Single Mother Poverty
In terms of single mother poverty, the demographic groups most similar to Iranians are Bhutanese (25.6%, a difference of 0.37%), Indian (Asian) (25.8%, a difference of 0.89%), Immigrants from Singapore (25.8%, a difference of 1.0%), Immigrants from South Central Asia (25.3%, a difference of 1.1%), and Immigrants from Ireland (25.8%, a difference of 1.2%).
| Demographics | Rating | Rank | Single Mother Poverty |
| Filipinos | 100.0 /100 | #4 | Exceptional 24.3% |
| Immigrants | Hong Kong | 100.0 /100 | #5 | Exceptional 24.4% |
| Thais | 100.0 /100 | #6 | Exceptional 24.5% |
| Chinese | 100.0 /100 | #7 | Exceptional 24.6% |
| Immigrants | Iran | 100.0 /100 | #8 | Exceptional 25.1% |
| Immigrants | Lithuania | 100.0 /100 | #9 | Exceptional 25.2% |
| Immigrants | South Central Asia | 100.0 /100 | #10 | Exceptional 25.3% |
| Iranians | 100.0 /100 | #11 | Exceptional 25.5% |
| Bhutanese | 100.0 /100 | #12 | Exceptional 25.6% |
| Indians (Asian) | 100.0 /100 | #13 | Exceptional 25.8% |
| Immigrants | Singapore | 100.0 /100 | #14 | Exceptional 25.8% |
| Immigrants | Ireland | 100.0 /100 | #15 | Exceptional 25.8% |
| Bolivians | 100.0 /100 | #16 | Exceptional 25.9% |
| Asians | 100.0 /100 | #17 | Exceptional 26.0% |
| Immigrants | Pakistan | 100.0 /100 | #18 | Exceptional 26.0% |
Demographics Similar to Immigrants from Cambodia by Single Mother Poverty
In terms of single mother poverty, the demographic groups most similar to Immigrants from Cambodia are Scandinavian (28.9%, a difference of 0.020%), Immigrants from Nigeria (28.9%, a difference of 0.040%), Immigrants from Kenya (28.9%, a difference of 0.040%), Japanese (28.9%, a difference of 0.080%), and Czech (28.9%, a difference of 0.10%).
| Demographics | Rating | Rank | Single Mother Poverty |
| Portuguese | 73.2 /100 | #154 | Good 28.8% |
| Ugandans | 71.7 /100 | #155 | Good 28.8% |
| Iraqis | 71.5 /100 | #156 | Good 28.8% |
| Immigrants | Western Europe | 71.1 /100 | #157 | Good 28.9% |
| Immigrants | Hungary | 70.6 /100 | #158 | Good 28.9% |
| Czechs | 68.4 /100 | #159 | Good 28.9% |
| Japanese | 68.0 /100 | #160 | Good 28.9% |
| Immigrants | Cambodia | 66.6 /100 | #161 | Good 28.9% |
| Scandinavians | 66.2 /100 | #162 | Good 28.9% |
| Immigrants | Nigeria | 65.9 /100 | #163 | Good 28.9% |
| Immigrants | Kenya | 65.9 /100 | #164 | Good 28.9% |
| Arabs | 60.7 /100 | #165 | Good 29.0% |
| Inupiat | 60.4 /100 | #166 | Good 29.0% |
| Costa Ricans | 58.4 /100 | #167 | Average 29.0% |
| Europeans | 57.6 /100 | #168 | Average 29.1% |