Iranian vs Belizean Single Mother Poverty
COMPARE
Iranian
Belizean
Single Mother Poverty
Single Mother Poverty Comparison
Iranians
Belizeans
25.5%
SINGLE MOTHER POVERTY
100.0/ 100
METRIC RATING
11th/ 347
METRIC RANK
31.0%
SINGLE MOTHER POVERTY
0.5/ 100
METRIC RATING
255th/ 347
METRIC RANK
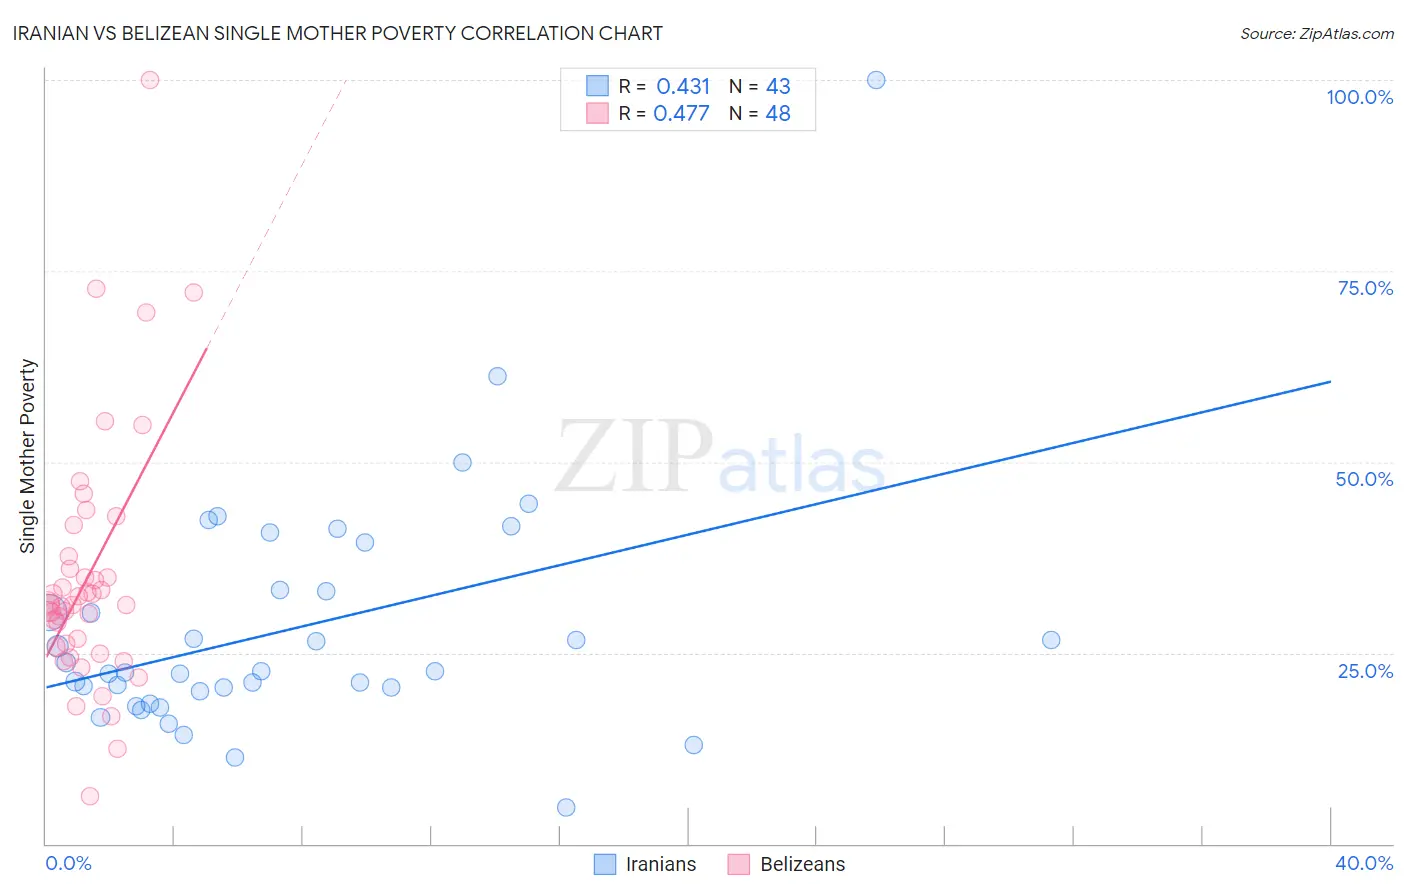
Iranian vs Belizean Single Mother Poverty Correlation Chart
The statistical analysis conducted on geographies consisting of 309,556,890 people shows a moderate positive correlation between the proportion of Iranians and poverty level among single mothers in the United States with a correlation coefficient (R) of 0.431 and weighted average of 25.5%. Similarly, the statistical analysis conducted on geographies consisting of 143,389,155 people shows a moderate positive correlation between the proportion of Belizeans and poverty level among single mothers in the United States with a correlation coefficient (R) of 0.477 and weighted average of 31.0%, a difference of 21.5%.
Single Mother Poverty Correlation Summary
| Measurement | Iranian | Belizean |
| Minimum | 4.7% | 6.2% |
| Maximum | 100.0% | 100.0% |
| Range | 95.3% | 93.8% |
| Mean | 28.2% | 35.0% |
| Median | 22.5% | 31.4% |
| Interquartile 25% (IQ1) | 20.0% | 26.0% |
| Interquartile 75% (IQ3) | 33.3% | 36.8% |
| Interquartile Range (IQR) | 13.2% | 10.9% |
| Standard Deviation (Sample) | 16.0% | 16.6% |
| Standard Deviation (Population) | 15.8% | 16.5% |
Similar Demographics by Single Mother Poverty
Demographics Similar to Iranians by Single Mother Poverty
In terms of single mother poverty, the demographic groups most similar to Iranians are Bhutanese (25.6%, a difference of 0.37%), Indian (Asian) (25.8%, a difference of 0.89%), Immigrants from Singapore (25.8%, a difference of 1.0%), Immigrants from South Central Asia (25.3%, a difference of 1.1%), and Immigrants from Ireland (25.8%, a difference of 1.2%).
| Demographics | Rating | Rank | Single Mother Poverty |
| Filipinos | 100.0 /100 | #4 | Exceptional 24.3% |
| Immigrants | Hong Kong | 100.0 /100 | #5 | Exceptional 24.4% |
| Thais | 100.0 /100 | #6 | Exceptional 24.5% |
| Chinese | 100.0 /100 | #7 | Exceptional 24.6% |
| Immigrants | Iran | 100.0 /100 | #8 | Exceptional 25.1% |
| Immigrants | Lithuania | 100.0 /100 | #9 | Exceptional 25.2% |
| Immigrants | South Central Asia | 100.0 /100 | #10 | Exceptional 25.3% |
| Iranians | 100.0 /100 | #11 | Exceptional 25.5% |
| Bhutanese | 100.0 /100 | #12 | Exceptional 25.6% |
| Indians (Asian) | 100.0 /100 | #13 | Exceptional 25.8% |
| Immigrants | Singapore | 100.0 /100 | #14 | Exceptional 25.8% |
| Immigrants | Ireland | 100.0 /100 | #15 | Exceptional 25.8% |
| Bolivians | 100.0 /100 | #16 | Exceptional 25.9% |
| Asians | 100.0 /100 | #17 | Exceptional 26.0% |
| Immigrants | Pakistan | 100.0 /100 | #18 | Exceptional 26.0% |
Demographics Similar to Belizeans by Single Mother Poverty
In terms of single mother poverty, the demographic groups most similar to Belizeans are Senegalese (31.0%, a difference of 0.11%), Immigrants from West Indies (31.1%, a difference of 0.21%), Celtic (30.9%, a difference of 0.25%), Immigrants from Bahamas (31.1%, a difference of 0.26%), and Alaska Native (30.9%, a difference of 0.28%).
| Demographics | Rating | Rank | Single Mother Poverty |
| French Canadians | 0.9 /100 | #248 | Tragic 30.8% |
| Cape Verdeans | 0.8 /100 | #249 | Tragic 30.8% |
| Vietnamese | 0.7 /100 | #250 | Tragic 30.9% |
| Tlingit-Haida | 0.6 /100 | #251 | Tragic 30.9% |
| Alaska Natives | 0.6 /100 | #252 | Tragic 30.9% |
| Celtics | 0.6 /100 | #253 | Tragic 30.9% |
| Senegalese | 0.5 /100 | #254 | Tragic 31.0% |
| Belizeans | 0.5 /100 | #255 | Tragic 31.0% |
| Immigrants | West Indies | 0.4 /100 | #256 | Tragic 31.1% |
| Immigrants | Bahamas | 0.4 /100 | #257 | Tragic 31.1% |
| Immigrants | Caribbean | 0.4 /100 | #258 | Tragic 31.1% |
| Immigrants | Bangladesh | 0.4 /100 | #259 | Tragic 31.1% |
| Whites/Caucasians | 0.3 /100 | #260 | Tragic 31.2% |
| Immigrants | El Salvador | 0.3 /100 | #261 | Tragic 31.2% |
| Hmong | 0.3 /100 | #262 | Tragic 31.2% |