Afghan vs Yakama Single Mother Poverty
COMPARE
Afghan
Yakama
Single Mother Poverty
Single Mother Poverty Comparison
Afghans
Yakama
27.7%
SINGLE MOTHER POVERTY
98.5/ 100
METRIC RATING
87th/ 347
METRIC RANK
36.4%
SINGLE MOTHER POVERTY
0.0/ 100
METRIC RATING
327th/ 347
METRIC RANK
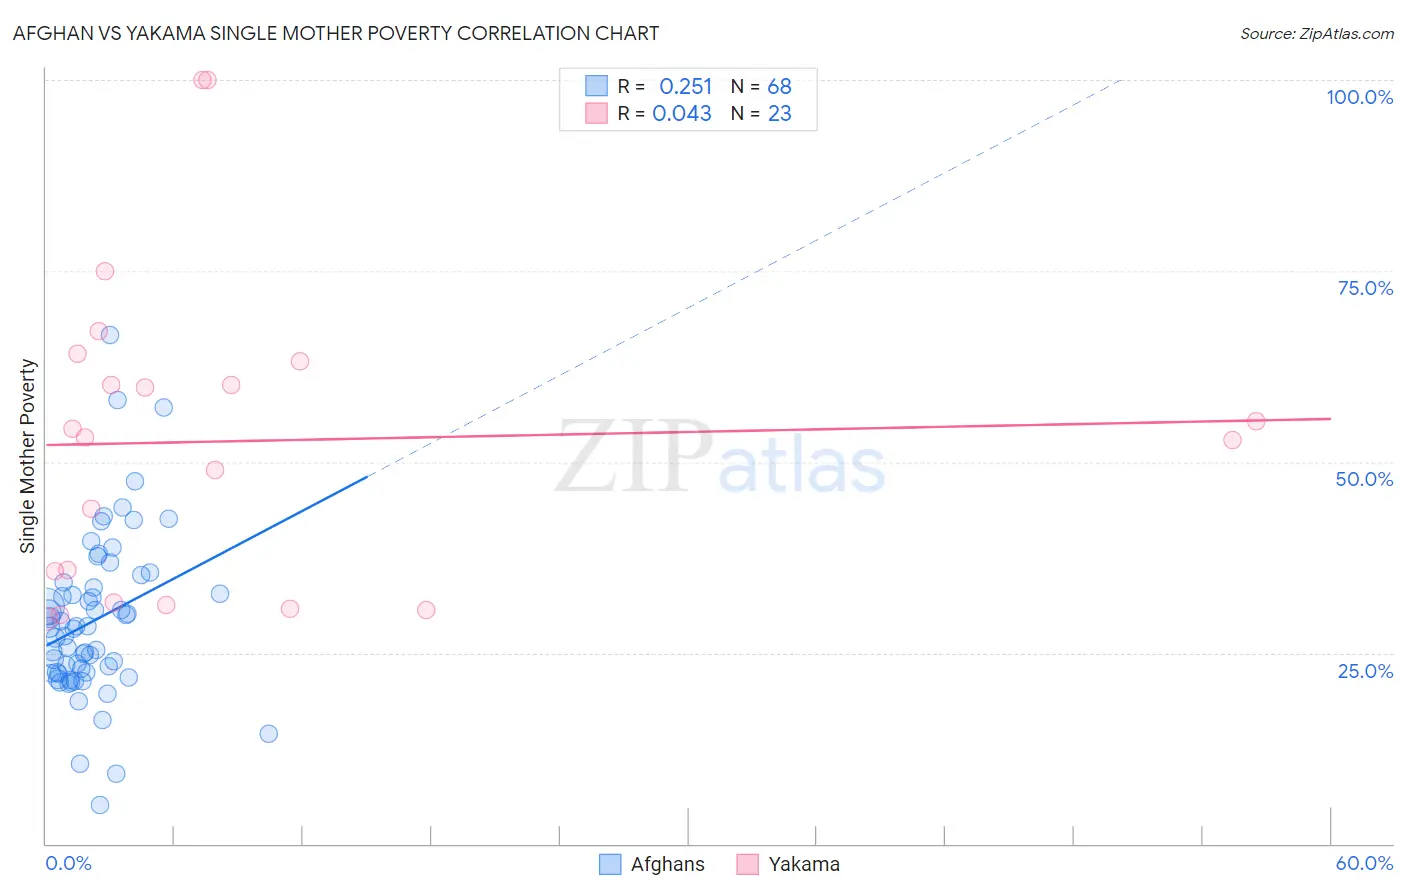
Afghan vs Yakama Single Mother Poverty Correlation Chart
The statistical analysis conducted on geographies consisting of 147,050,043 people shows a weak positive correlation between the proportion of Afghans and poverty level among single mothers in the United States with a correlation coefficient (R) of 0.251 and weighted average of 27.7%. Similarly, the statistical analysis conducted on geographies consisting of 19,786,189 people shows no correlation between the proportion of Yakama and poverty level among single mothers in the United States with a correlation coefficient (R) of 0.043 and weighted average of 36.4%, a difference of 31.3%.
Single Mother Poverty Correlation Summary
| Measurement | Afghan | Yakama |
| Minimum | 5.1% | 29.5% |
| Maximum | 66.7% | 100.0% |
| Range | 61.5% | 70.5% |
| Mean | 29.3% | 52.7% |
| Median | 28.2% | 53.2% |
| Interquartile 25% (IQ1) | 22.4% | 31.6% |
| Interquartile 75% (IQ3) | 33.9% | 63.2% |
| Interquartile Range (IQR) | 11.6% | 31.6% |
| Standard Deviation (Sample) | 10.8% | 20.4% |
| Standard Deviation (Population) | 10.7% | 20.0% |
Similar Demographics by Single Mother Poverty
Demographics Similar to Afghans by Single Mother Poverty
In terms of single mother poverty, the demographic groups most similar to Afghans are Ethiopian (27.7%, a difference of 0.020%), Immigrants from Ethiopia (27.7%, a difference of 0.040%), Immigrants from Ukraine (27.7%, a difference of 0.10%), Mongolian (27.7%, a difference of 0.19%), and Immigrants from Latvia (27.7%, a difference of 0.20%).
| Demographics | Rating | Rank | Single Mother Poverty |
| Taiwanese | 99.1 /100 | #80 | Exceptional 27.5% |
| Immigrants | Scotland | 98.9 /100 | #81 | Exceptional 27.6% |
| Immigrants | Cameroon | 98.8 /100 | #82 | Exceptional 27.6% |
| Greeks | 98.7 /100 | #83 | Exceptional 27.7% |
| Immigrants | Latvia | 98.7 /100 | #84 | Exceptional 27.7% |
| Mongolians | 98.7 /100 | #85 | Exceptional 27.7% |
| Immigrants | Ukraine | 98.6 /100 | #86 | Exceptional 27.7% |
| Afghans | 98.5 /100 | #87 | Exceptional 27.7% |
| Ethiopians | 98.4 /100 | #88 | Exceptional 27.7% |
| Immigrants | Ethiopia | 98.4 /100 | #89 | Exceptional 27.7% |
| Immigrants | France | 98.2 /100 | #90 | Exceptional 27.8% |
| Immigrants | Albania | 98.0 /100 | #91 | Exceptional 27.8% |
| Estonians | 97.9 /100 | #92 | Exceptional 27.8% |
| Romanians | 97.8 /100 | #93 | Exceptional 27.8% |
| Albanians | 97.6 /100 | #94 | Exceptional 27.9% |
Demographics Similar to Yakama by Single Mother Poverty
In terms of single mother poverty, the demographic groups most similar to Yakama are Choctaw (36.4%, a difference of 0.060%), Apache (36.6%, a difference of 0.53%), Native/Alaskan (36.6%, a difference of 0.64%), Creek (36.7%, a difference of 0.79%), and Dutch West Indian (36.8%, a difference of 1.0%).
| Demographics | Rating | Rank | Single Mother Poverty |
| Iroquois | 0.0 /100 | #320 | Tragic 34.8% |
| Paiute | 0.0 /100 | #321 | Tragic 35.1% |
| Blacks/African Americans | 0.0 /100 | #322 | Tragic 35.2% |
| Kiowa | 0.0 /100 | #323 | Tragic 35.5% |
| Ottawa | 0.0 /100 | #324 | Tragic 35.5% |
| Ute | 0.0 /100 | #325 | Tragic 35.7% |
| Seminole | 0.0 /100 | #326 | Tragic 35.8% |
| Yakama | 0.0 /100 | #327 | Tragic 36.4% |
| Choctaw | 0.0 /100 | #328 | Tragic 36.4% |
| Apache | 0.0 /100 | #329 | Tragic 36.6% |
| Natives/Alaskans | 0.0 /100 | #330 | Tragic 36.6% |
| Creek | 0.0 /100 | #331 | Tragic 36.7% |
| Dutch West Indians | 0.0 /100 | #332 | Tragic 36.8% |
| Menominee | 0.0 /100 | #333 | Tragic 37.1% |
| Pueblo | 0.0 /100 | #334 | Tragic 37.2% |