Iranian vs Immigrants from Cameroon Single Mother Poverty
COMPARE
Iranian
Immigrants from Cameroon
Single Mother Poverty
Single Mother Poverty Comparison
Iranians
Immigrants from Cameroon
25.5%
SINGLE MOTHER POVERTY
100.0/ 100
METRIC RATING
11th/ 347
METRIC RANK
27.6%
SINGLE MOTHER POVERTY
98.8/ 100
METRIC RATING
82nd/ 347
METRIC RANK
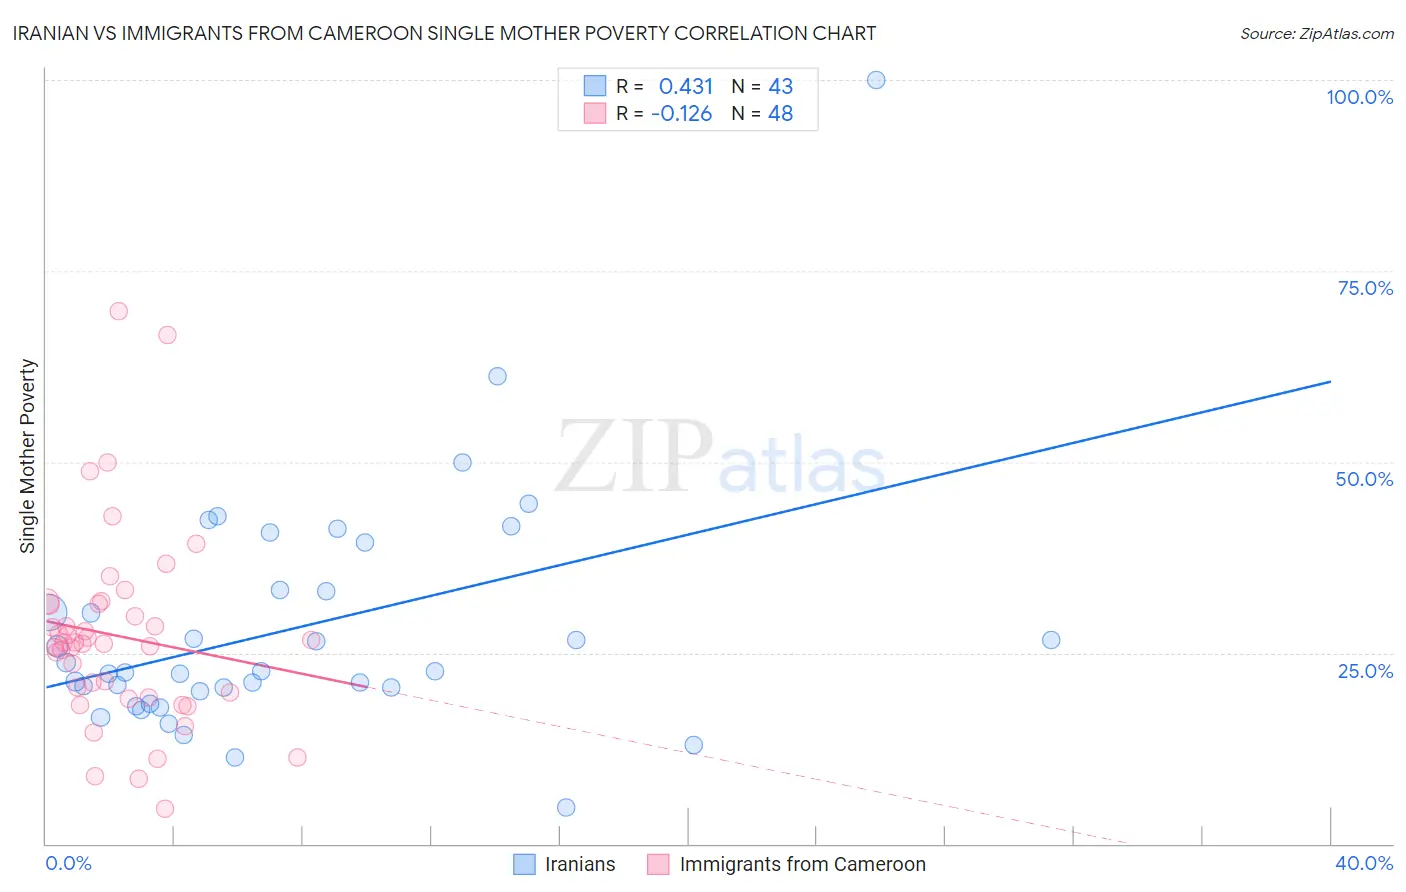
Iranian vs Immigrants from Cameroon Single Mother Poverty Correlation Chart
The statistical analysis conducted on geographies consisting of 309,556,890 people shows a moderate positive correlation between the proportion of Iranians and poverty level among single mothers in the United States with a correlation coefficient (R) of 0.431 and weighted average of 25.5%. Similarly, the statistical analysis conducted on geographies consisting of 129,897,346 people shows a poor negative correlation between the proportion of Immigrants from Cameroon and poverty level among single mothers in the United States with a correlation coefficient (R) of -0.126 and weighted average of 27.6%, a difference of 8.3%.
Single Mother Poverty Correlation Summary
| Measurement | Iranian | Immigrants from Cameroon |
| Minimum | 4.7% | 4.5% |
| Maximum | 100.0% | 69.7% |
| Range | 95.3% | 65.2% |
| Mean | 28.2% | 27.2% |
| Median | 22.5% | 26.3% |
| Interquartile 25% (IQ1) | 20.0% | 19.5% |
| Interquartile 75% (IQ3) | 33.3% | 31.4% |
| Interquartile Range (IQR) | 13.2% | 11.9% |
| Standard Deviation (Sample) | 16.0% | 12.7% |
| Standard Deviation (Population) | 15.8% | 12.6% |
Similar Demographics by Single Mother Poverty
Demographics Similar to Iranians by Single Mother Poverty
In terms of single mother poverty, the demographic groups most similar to Iranians are Bhutanese (25.6%, a difference of 0.37%), Indian (Asian) (25.8%, a difference of 0.89%), Immigrants from Singapore (25.8%, a difference of 1.0%), Immigrants from South Central Asia (25.3%, a difference of 1.1%), and Immigrants from Ireland (25.8%, a difference of 1.2%).
| Demographics | Rating | Rank | Single Mother Poverty |
| Filipinos | 100.0 /100 | #4 | Exceptional 24.3% |
| Immigrants | Hong Kong | 100.0 /100 | #5 | Exceptional 24.4% |
| Thais | 100.0 /100 | #6 | Exceptional 24.5% |
| Chinese | 100.0 /100 | #7 | Exceptional 24.6% |
| Immigrants | Iran | 100.0 /100 | #8 | Exceptional 25.1% |
| Immigrants | Lithuania | 100.0 /100 | #9 | Exceptional 25.2% |
| Immigrants | South Central Asia | 100.0 /100 | #10 | Exceptional 25.3% |
| Iranians | 100.0 /100 | #11 | Exceptional 25.5% |
| Bhutanese | 100.0 /100 | #12 | Exceptional 25.6% |
| Indians (Asian) | 100.0 /100 | #13 | Exceptional 25.8% |
| Immigrants | Singapore | 100.0 /100 | #14 | Exceptional 25.8% |
| Immigrants | Ireland | 100.0 /100 | #15 | Exceptional 25.8% |
| Bolivians | 100.0 /100 | #16 | Exceptional 25.9% |
| Asians | 100.0 /100 | #17 | Exceptional 26.0% |
| Immigrants | Pakistan | 100.0 /100 | #18 | Exceptional 26.0% |
Demographics Similar to Immigrants from Cameroon by Single Mother Poverty
In terms of single mother poverty, the demographic groups most similar to Immigrants from Cameroon are Greek (27.7%, a difference of 0.050%), Immigrants from Latvia (27.7%, a difference of 0.090%), Mongolian (27.7%, a difference of 0.090%), Immigrants from Scotland (27.6%, a difference of 0.12%), and Immigrants from Ukraine (27.7%, a difference of 0.18%).
| Demographics | Rating | Rank | Single Mother Poverty |
| Immigrants | Sweden | 99.2 /100 | #75 | Exceptional 27.5% |
| Peruvians | 99.2 /100 | #76 | Exceptional 27.5% |
| Immigrants | Peru | 99.2 /100 | #77 | Exceptional 27.5% |
| Immigrants | North Macedonia | 99.2 /100 | #78 | Exceptional 27.5% |
| Immigrants | Italy | 99.1 /100 | #79 | Exceptional 27.5% |
| Taiwanese | 99.1 /100 | #80 | Exceptional 27.5% |
| Immigrants | Scotland | 98.9 /100 | #81 | Exceptional 27.6% |
| Immigrants | Cameroon | 98.8 /100 | #82 | Exceptional 27.6% |
| Greeks | 98.7 /100 | #83 | Exceptional 27.7% |
| Immigrants | Latvia | 98.7 /100 | #84 | Exceptional 27.7% |
| Mongolians | 98.7 /100 | #85 | Exceptional 27.7% |
| Immigrants | Ukraine | 98.6 /100 | #86 | Exceptional 27.7% |
| Afghans | 98.5 /100 | #87 | Exceptional 27.7% |
| Ethiopians | 98.4 /100 | #88 | Exceptional 27.7% |
| Immigrants | Ethiopia | 98.4 /100 | #89 | Exceptional 27.7% |