Iranian vs Chilean Single Mother Poverty
COMPARE
Iranian
Chilean
Single Mother Poverty
Single Mother Poverty Comparison
Iranians
Chileans
25.5%
SINGLE MOTHER POVERTY
100.0/ 100
METRIC RATING
11th/ 347
METRIC RANK
27.9%
SINGLE MOTHER POVERTY
97.5/ 100
METRIC RATING
95th/ 347
METRIC RANK
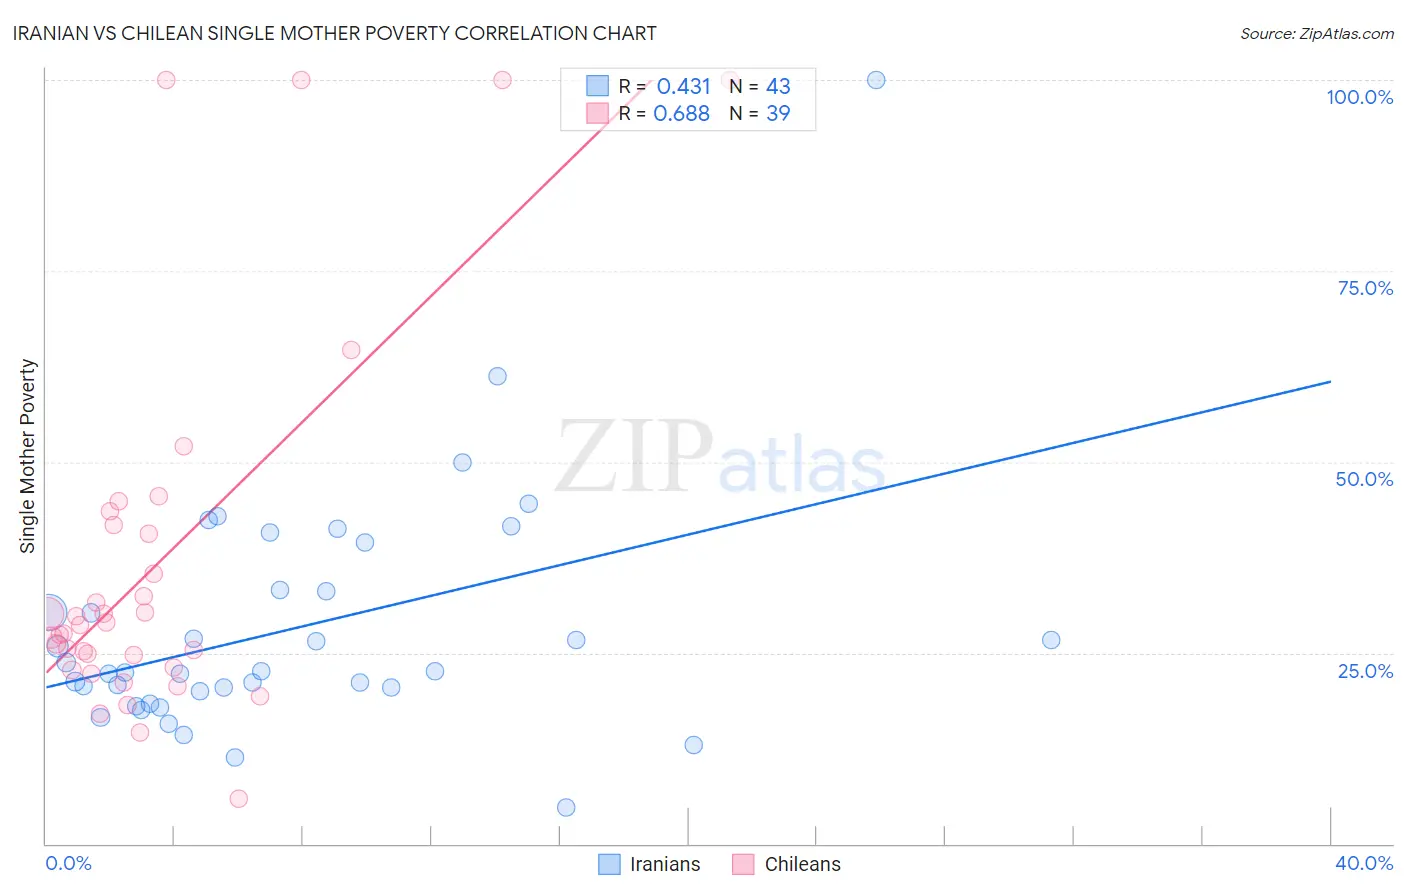
Iranian vs Chilean Single Mother Poverty Correlation Chart
The statistical analysis conducted on geographies consisting of 309,556,890 people shows a moderate positive correlation between the proportion of Iranians and poverty level among single mothers in the United States with a correlation coefficient (R) of 0.431 and weighted average of 25.5%. Similarly, the statistical analysis conducted on geographies consisting of 252,857,793 people shows a significant positive correlation between the proportion of Chileans and poverty level among single mothers in the United States with a correlation coefficient (R) of 0.688 and weighted average of 27.9%, a difference of 9.2%.
Single Mother Poverty Correlation Summary
| Measurement | Iranian | Chilean |
| Minimum | 4.7% | 5.9% |
| Maximum | 100.0% | 100.0% |
| Range | 95.3% | 94.1% |
| Mean | 28.2% | 36.6% |
| Median | 22.5% | 28.7% |
| Interquartile 25% (IQ1) | 20.0% | 23.1% |
| Interquartile 75% (IQ3) | 33.3% | 41.7% |
| Interquartile Range (IQR) | 13.2% | 18.5% |
| Standard Deviation (Sample) | 16.0% | 24.2% |
| Standard Deviation (Population) | 15.8% | 23.9% |
Similar Demographics by Single Mother Poverty
Demographics Similar to Iranians by Single Mother Poverty
In terms of single mother poverty, the demographic groups most similar to Iranians are Bhutanese (25.6%, a difference of 0.37%), Indian (Asian) (25.8%, a difference of 0.89%), Immigrants from Singapore (25.8%, a difference of 1.0%), Immigrants from South Central Asia (25.3%, a difference of 1.1%), and Immigrants from Ireland (25.8%, a difference of 1.2%).
| Demographics | Rating | Rank | Single Mother Poverty |
| Filipinos | 100.0 /100 | #4 | Exceptional 24.3% |
| Immigrants | Hong Kong | 100.0 /100 | #5 | Exceptional 24.4% |
| Thais | 100.0 /100 | #6 | Exceptional 24.5% |
| Chinese | 100.0 /100 | #7 | Exceptional 24.6% |
| Immigrants | Iran | 100.0 /100 | #8 | Exceptional 25.1% |
| Immigrants | Lithuania | 100.0 /100 | #9 | Exceptional 25.2% |
| Immigrants | South Central Asia | 100.0 /100 | #10 | Exceptional 25.3% |
| Iranians | 100.0 /100 | #11 | Exceptional 25.5% |
| Bhutanese | 100.0 /100 | #12 | Exceptional 25.6% |
| Indians (Asian) | 100.0 /100 | #13 | Exceptional 25.8% |
| Immigrants | Singapore | 100.0 /100 | #14 | Exceptional 25.8% |
| Immigrants | Ireland | 100.0 /100 | #15 | Exceptional 25.8% |
| Bolivians | 100.0 /100 | #16 | Exceptional 25.9% |
| Asians | 100.0 /100 | #17 | Exceptional 26.0% |
| Immigrants | Pakistan | 100.0 /100 | #18 | Exceptional 26.0% |
Demographics Similar to Chileans by Single Mother Poverty
In terms of single mother poverty, the demographic groups most similar to Chileans are Albanian (27.9%, a difference of 0.030%), Immigrants from Iraq (27.9%, a difference of 0.10%), Romanian (27.8%, a difference of 0.13%), Immigrants from Brazil (27.9%, a difference of 0.14%), and Immigrants from Nepal (27.9%, a difference of 0.15%).
| Demographics | Rating | Rank | Single Mother Poverty |
| Ethiopians | 98.4 /100 | #88 | Exceptional 27.7% |
| Immigrants | Ethiopia | 98.4 /100 | #89 | Exceptional 27.7% |
| Immigrants | France | 98.2 /100 | #90 | Exceptional 27.8% |
| Immigrants | Albania | 98.0 /100 | #91 | Exceptional 27.8% |
| Estonians | 97.9 /100 | #92 | Exceptional 27.8% |
| Romanians | 97.8 /100 | #93 | Exceptional 27.8% |
| Albanians | 97.6 /100 | #94 | Exceptional 27.9% |
| Chileans | 97.5 /100 | #95 | Exceptional 27.9% |
| Immigrants | Iraq | 97.3 /100 | #96 | Exceptional 27.9% |
| Immigrants | Brazil | 97.2 /100 | #97 | Exceptional 27.9% |
| Immigrants | Nepal | 97.2 /100 | #98 | Exceptional 27.9% |
| Immigrants | Netherlands | 97.2 /100 | #99 | Exceptional 27.9% |
| Zimbabweans | 97.1 /100 | #100 | Exceptional 27.9% |
| Pakistanis | 96.9 /100 | #101 | Exceptional 28.0% |
| Immigrants | Croatia | 96.7 /100 | #102 | Exceptional 28.0% |