Iranian vs Yakama In Labor Force | Age 45-54
COMPARE
Iranian
Yakama
In Labor Force | Age 45-54
In Labor Force | Age 45-54 Comparison
Iranians
Yakama
83.2%
IN LABOR FORCE | AGE 45-54
92.9/ 100
METRIC RATING
107th/ 347
METRIC RANK
80.6%
IN LABOR FORCE | AGE 45-54
0.0/ 100
METRIC RATING
294th/ 347
METRIC RANK
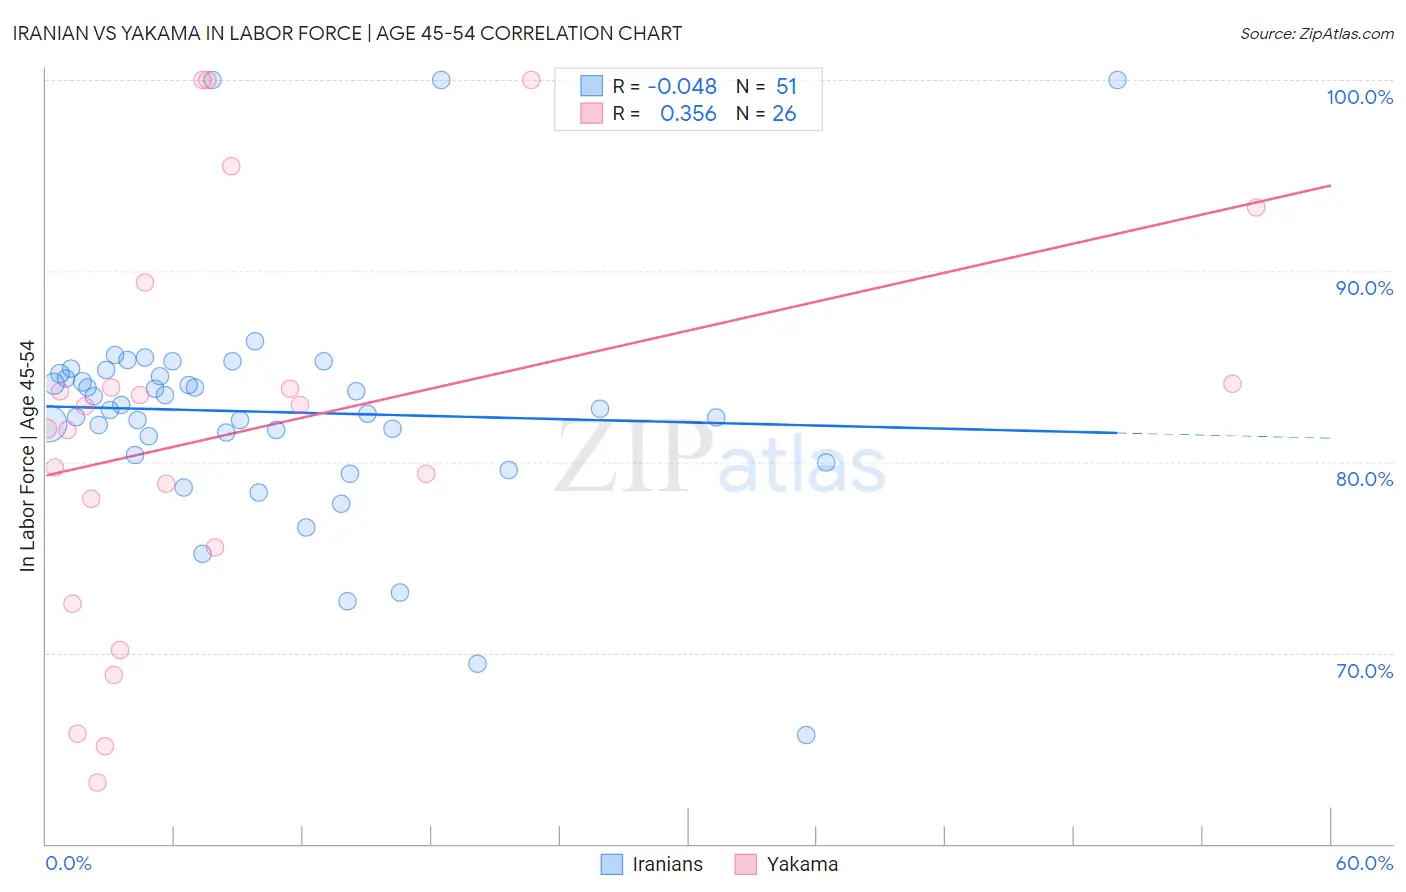
Iranian vs Yakama In Labor Force | Age 45-54 Correlation Chart
The statistical analysis conducted on geographies consisting of 316,652,476 people shows no correlation between the proportion of Iranians and labor force participation rate among population between the ages 45 and 54 in the United States with a correlation coefficient (R) of -0.048 and weighted average of 83.2%. Similarly, the statistical analysis conducted on geographies consisting of 19,917,759 people shows a mild positive correlation between the proportion of Yakama and labor force participation rate among population between the ages 45 and 54 in the United States with a correlation coefficient (R) of 0.356 and weighted average of 80.6%, a difference of 3.3%.
In Labor Force | Age 45-54 Correlation Summary
| Measurement | Iranian | Yakama |
| Minimum | 65.7% | 63.2% |
| Maximum | 100.0% | 100.0% |
| Range | 34.3% | 36.8% |
| Mean | 82.6% | 81.7% |
| Median | 82.8% | 82.3% |
| Interquartile 25% (IQ1) | 80.4% | 75.5% |
| Interquartile 75% (IQ3) | 84.6% | 84.1% |
| Interquartile Range (IQR) | 4.3% | 8.6% |
| Standard Deviation (Sample) | 6.1% | 10.5% |
| Standard Deviation (Population) | 6.0% | 10.3% |
Similar Demographics by In Labor Force | Age 45-54
Demographics Similar to Iranians by In Labor Force | Age 45-54
In terms of in labor force | age 45-54, the demographic groups most similar to Iranians are Slovak (83.2%, a difference of 0.0%), Sri Lankan (83.2%, a difference of 0.010%), Ukrainian (83.2%, a difference of 0.010%), Immigrants from Africa (83.2%, a difference of 0.010%), and Immigrants from Italy (83.2%, a difference of 0.010%).
| Demographics | Rating | Rank | In Labor Force | Age 45-54 |
| Mongolians | 94.2 /100 | #100 | Exceptional 83.3% |
| Immigrants | Belarus | 94.1 /100 | #101 | Exceptional 83.3% |
| Immigrants | Singapore | 93.9 /100 | #102 | Exceptional 83.3% |
| Albanians | 93.9 /100 | #103 | Exceptional 83.3% |
| Immigrants | Romania | 93.8 /100 | #104 | Exceptional 83.3% |
| Immigrants | South America | 93.5 /100 | #105 | Exceptional 83.2% |
| Sri Lankans | 93.2 /100 | #106 | Exceptional 83.2% |
| Iranians | 92.9 /100 | #107 | Exceptional 83.2% |
| Slovaks | 92.8 /100 | #108 | Exceptional 83.2% |
| Ukrainians | 92.7 /100 | #109 | Exceptional 83.2% |
| Immigrants | Africa | 92.6 /100 | #110 | Exceptional 83.2% |
| Immigrants | Italy | 92.5 /100 | #111 | Exceptional 83.2% |
| Immigrants | Afghanistan | 92.4 /100 | #112 | Exceptional 83.2% |
| Immigrants | Albania | 91.8 /100 | #113 | Exceptional 83.2% |
| Assyrians/Chaldeans/Syriacs | 91.7 /100 | #114 | Exceptional 83.2% |
Demographics Similar to Yakama by In Labor Force | Age 45-54
In terms of in labor force | age 45-54, the demographic groups most similar to Yakama are Osage (80.6%, a difference of 0.0%), Iroquois (80.6%, a difference of 0.020%), Immigrants from Belize (80.6%, a difference of 0.050%), Nepalese (80.5%, a difference of 0.070%), and African (80.5%, a difference of 0.10%).
| Demographics | Rating | Rank | In Labor Force | Age 45-54 |
| Vietnamese | 0.0 /100 | #287 | Tragic 80.8% |
| Cree | 0.0 /100 | #288 | Tragic 80.8% |
| Immigrants | Bangladesh | 0.0 /100 | #289 | Tragic 80.7% |
| Mexican American Indians | 0.0 /100 | #290 | Tragic 80.7% |
| Immigrants | Belize | 0.0 /100 | #291 | Tragic 80.6% |
| Iroquois | 0.0 /100 | #292 | Tragic 80.6% |
| Osage | 0.0 /100 | #293 | Tragic 80.6% |
| Yakama | 0.0 /100 | #294 | Tragic 80.6% |
| Nepalese | 0.0 /100 | #295 | Tragic 80.5% |
| Africans | 0.0 /100 | #296 | Tragic 80.5% |
| Americans | 0.0 /100 | #297 | Tragic 80.4% |
| Marshallese | 0.0 /100 | #298 | Tragic 80.3% |
| Dominicans | 0.0 /100 | #299 | Tragic 80.3% |
| Fijians | 0.0 /100 | #300 | Tragic 80.2% |
| Spanish American Indians | 0.0 /100 | #301 | Tragic 80.2% |