Iranian vs African Single Mother Poverty
COMPARE
Iranian
African
Single Mother Poverty
Single Mother Poverty Comparison
Iranians
Africans
25.5%
SINGLE MOTHER POVERTY
100.0/ 100
METRIC RATING
11th/ 347
METRIC RANK
33.3%
SINGLE MOTHER POVERTY
0.0/ 100
METRIC RATING
298th/ 347
METRIC RANK
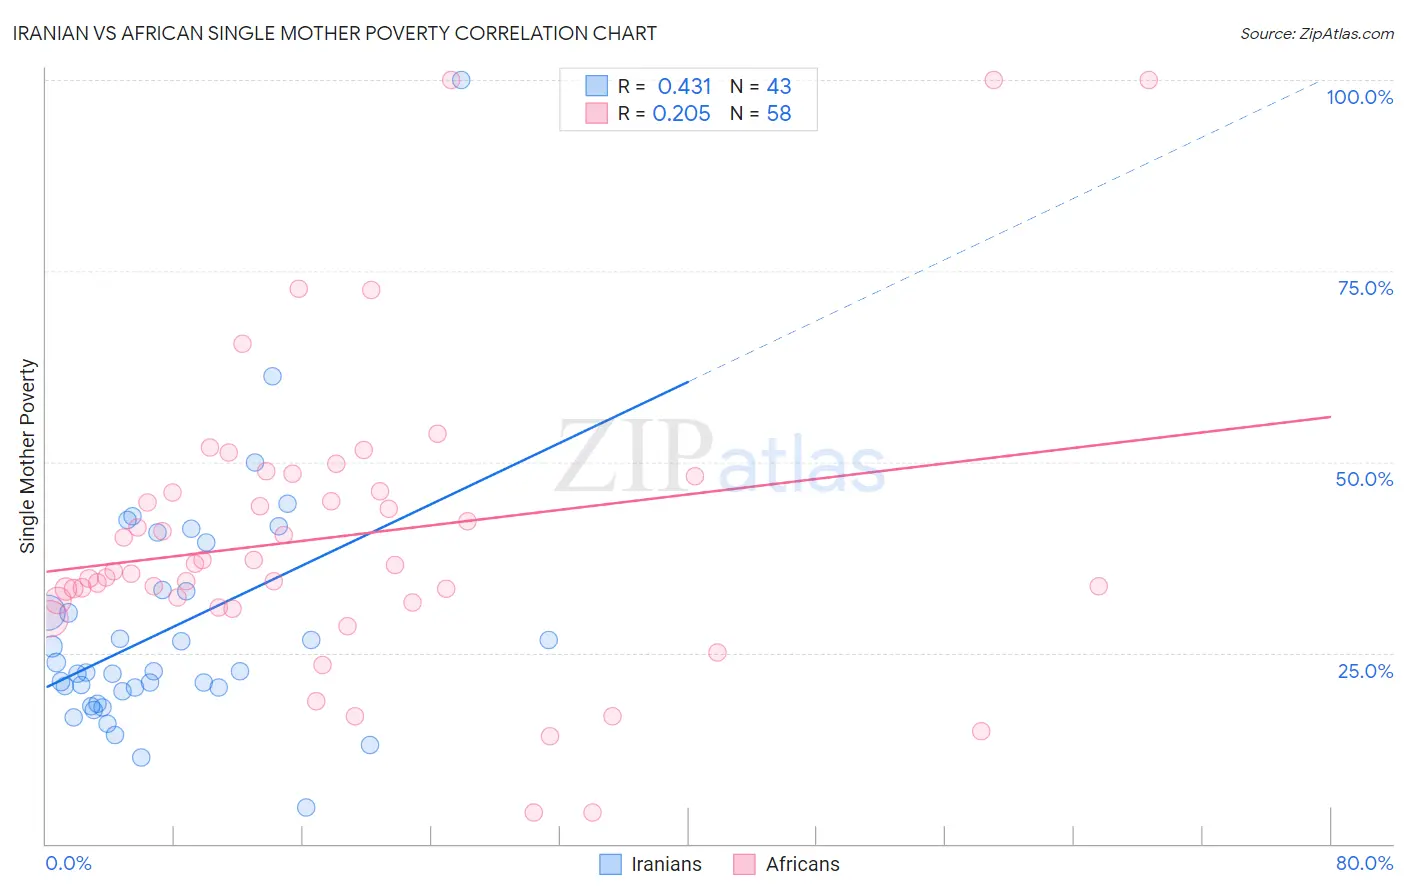
Iranian vs African Single Mother Poverty Correlation Chart
The statistical analysis conducted on geographies consisting of 309,556,890 people shows a moderate positive correlation between the proportion of Iranians and poverty level among single mothers in the United States with a correlation coefficient (R) of 0.431 and weighted average of 25.5%. Similarly, the statistical analysis conducted on geographies consisting of 460,032,526 people shows a weak positive correlation between the proportion of Africans and poverty level among single mothers in the United States with a correlation coefficient (R) of 0.205 and weighted average of 33.3%, a difference of 30.4%.
Single Mother Poverty Correlation Summary
| Measurement | Iranian | African |
| Minimum | 4.7% | 4.1% |
| Maximum | 100.0% | 100.0% |
| Range | 95.3% | 95.9% |
| Mean | 28.2% | 40.2% |
| Median | 22.5% | 36.1% |
| Interquartile 25% (IQ1) | 20.0% | 31.9% |
| Interquartile 75% (IQ3) | 33.3% | 46.1% |
| Interquartile Range (IQR) | 13.2% | 14.2% |
| Standard Deviation (Sample) | 16.0% | 19.5% |
| Standard Deviation (Population) | 15.8% | 19.3% |
Similar Demographics by Single Mother Poverty
Demographics Similar to Iranians by Single Mother Poverty
In terms of single mother poverty, the demographic groups most similar to Iranians are Bhutanese (25.6%, a difference of 0.37%), Indian (Asian) (25.8%, a difference of 0.89%), Immigrants from Singapore (25.8%, a difference of 1.0%), Immigrants from South Central Asia (25.3%, a difference of 1.1%), and Immigrants from Ireland (25.8%, a difference of 1.2%).
| Demographics | Rating | Rank | Single Mother Poverty |
| Filipinos | 100.0 /100 | #4 | Exceptional 24.3% |
| Immigrants | Hong Kong | 100.0 /100 | #5 | Exceptional 24.4% |
| Thais | 100.0 /100 | #6 | Exceptional 24.5% |
| Chinese | 100.0 /100 | #7 | Exceptional 24.6% |
| Immigrants | Iran | 100.0 /100 | #8 | Exceptional 25.1% |
| Immigrants | Lithuania | 100.0 /100 | #9 | Exceptional 25.2% |
| Immigrants | South Central Asia | 100.0 /100 | #10 | Exceptional 25.3% |
| Iranians | 100.0 /100 | #11 | Exceptional 25.5% |
| Bhutanese | 100.0 /100 | #12 | Exceptional 25.6% |
| Indians (Asian) | 100.0 /100 | #13 | Exceptional 25.8% |
| Immigrants | Singapore | 100.0 /100 | #14 | Exceptional 25.8% |
| Immigrants | Ireland | 100.0 /100 | #15 | Exceptional 25.8% |
| Bolivians | 100.0 /100 | #16 | Exceptional 25.9% |
| Asians | 100.0 /100 | #17 | Exceptional 26.0% |
| Immigrants | Pakistan | 100.0 /100 | #18 | Exceptional 26.0% |
Demographics Similar to Africans by Single Mother Poverty
In terms of single mother poverty, the demographic groups most similar to Africans are Immigrants from Guatemala (33.3%, a difference of 0.090%), Hispanic or Latino (33.3%, a difference of 0.090%), Pennsylvania German (33.2%, a difference of 0.11%), Blackfeet (33.2%, a difference of 0.25%), and Immigrants from Somalia (33.4%, a difference of 0.33%).
| Demographics | Rating | Rank | Single Mother Poverty |
| Guatemalans | 0.0 /100 | #291 | Tragic 32.9% |
| Shoshone | 0.0 /100 | #292 | Tragic 32.9% |
| Aleuts | 0.0 /100 | #293 | Tragic 32.9% |
| French American Indians | 0.0 /100 | #294 | Tragic 33.1% |
| Yaqui | 0.0 /100 | #295 | Tragic 33.1% |
| Blackfeet | 0.0 /100 | #296 | Tragic 33.2% |
| Pennsylvania Germans | 0.0 /100 | #297 | Tragic 33.2% |
| Africans | 0.0 /100 | #298 | Tragic 33.3% |
| Immigrants | Guatemala | 0.0 /100 | #299 | Tragic 33.3% |
| Hispanics or Latinos | 0.0 /100 | #300 | Tragic 33.3% |
| Immigrants | Somalia | 0.0 /100 | #301 | Tragic 33.4% |
| Arapaho | 0.0 /100 | #302 | Tragic 33.4% |
| Americans | 0.0 /100 | #303 | Tragic 33.5% |
| Mexicans | 0.0 /100 | #304 | Tragic 33.6% |
| Immigrants | Central America | 0.0 /100 | #305 | Tragic 33.6% |