Tongan vs Dominican Single Mother Poverty
COMPARE
Tongan
Dominican
Single Mother Poverty
Single Mother Poverty Comparison
Tongans
Dominicans
26.5%
SINGLE MOTHER POVERTY
99.9/ 100
METRIC RATING
32nd/ 347
METRIC RANK
34.5%
SINGLE MOTHER POVERTY
0.0/ 100
METRIC RATING
316th/ 347
METRIC RANK
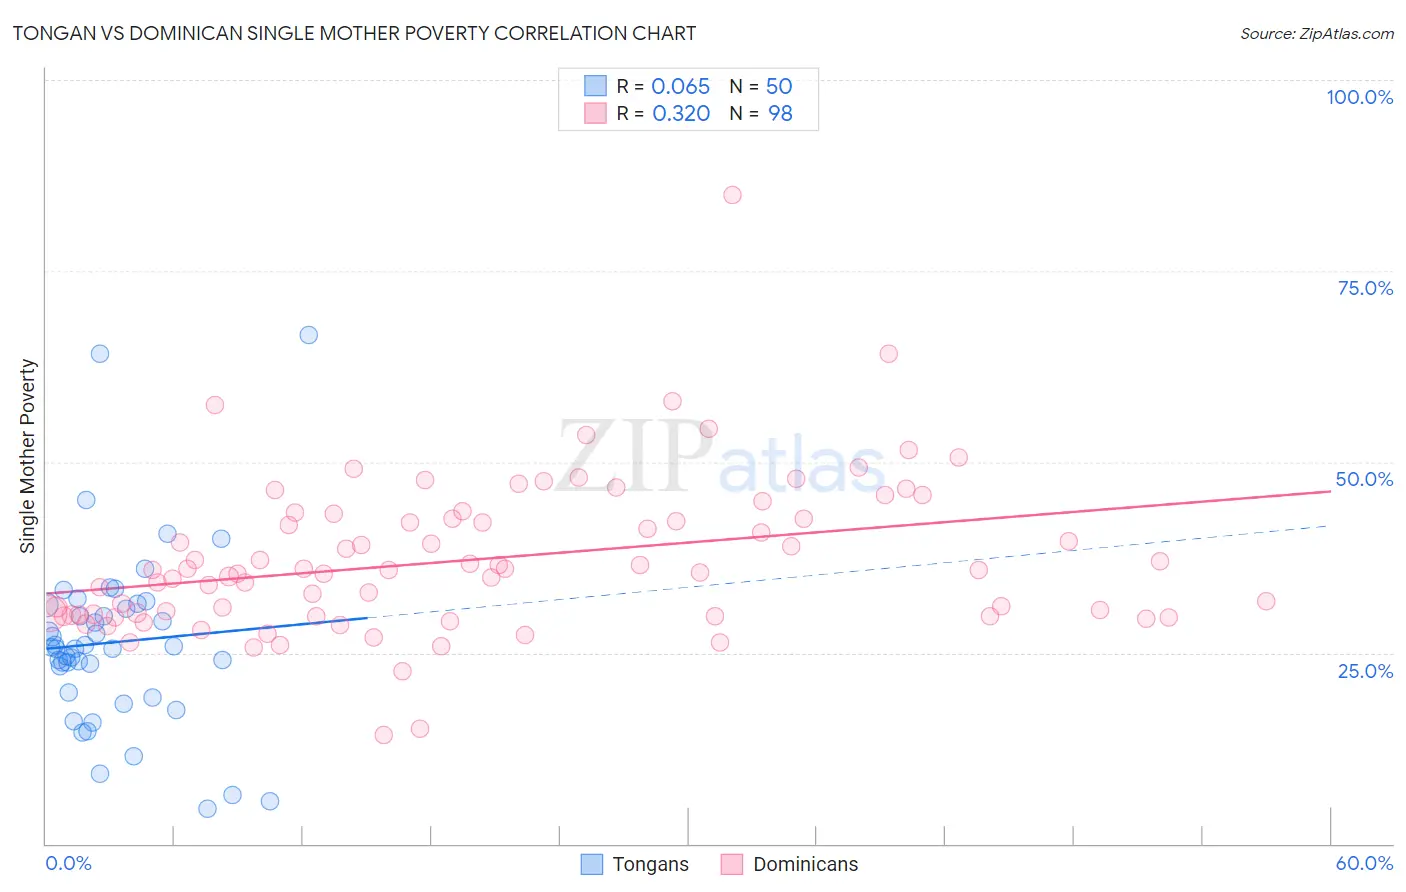
Tongan vs Dominican Single Mother Poverty Correlation Chart
The statistical analysis conducted on geographies consisting of 102,184,509 people shows a slight positive correlation between the proportion of Tongans and poverty level among single mothers in the United States with a correlation coefficient (R) of 0.065 and weighted average of 26.5%. Similarly, the statistical analysis conducted on geographies consisting of 347,165,672 people shows a mild positive correlation between the proportion of Dominicans and poverty level among single mothers in the United States with a correlation coefficient (R) of 0.320 and weighted average of 34.5%, a difference of 29.9%.
Single Mother Poverty Correlation Summary
| Measurement | Tongan | Dominican |
| Minimum | 4.6% | 14.2% |
| Maximum | 66.7% | 84.9% |
| Range | 62.1% | 70.7% |
| Mean | 26.4% | 37.2% |
| Median | 25.6% | 35.8% |
| Interquartile 25% (IQ1) | 19.8% | 30.0% |
| Interquartile 75% (IQ3) | 31.3% | 42.5% |
| Interquartile Range (IQR) | 11.5% | 12.6% |
| Standard Deviation (Sample) | 11.8% | 10.2% |
| Standard Deviation (Population) | 11.7% | 10.1% |
Similar Demographics by Single Mother Poverty
Demographics Similar to Tongans by Single Mother Poverty
In terms of single mother poverty, the demographic groups most similar to Tongans are Bulgarian (26.5%, a difference of 0.040%), Immigrants from Indonesia (26.6%, a difference of 0.050%), Maltese (26.6%, a difference of 0.17%), Okinawan (26.6%, a difference of 0.21%), and Immigrants from Israel (26.6%, a difference of 0.22%).
| Demographics | Rating | Rank | Single Mother Poverty |
| Immigrants | Asia | 100.0 /100 | #25 | Exceptional 26.3% |
| Immigrants | Sri Lanka | 100.0 /100 | #26 | Exceptional 26.3% |
| Immigrants | Japan | 100.0 /100 | #27 | Exceptional 26.4% |
| Koreans | 100.0 /100 | #28 | Exceptional 26.4% |
| Jordanians | 100.0 /100 | #29 | Exceptional 26.4% |
| Turks | 100.0 /100 | #30 | Exceptional 26.4% |
| Immigrants | Philippines | 100.0 /100 | #31 | Exceptional 26.5% |
| Tongans | 99.9 /100 | #32 | Exceptional 26.5% |
| Bulgarians | 99.9 /100 | #33 | Exceptional 26.5% |
| Immigrants | Indonesia | 99.9 /100 | #34 | Exceptional 26.6% |
| Maltese | 99.9 /100 | #35 | Exceptional 26.6% |
| Okinawans | 99.9 /100 | #36 | Exceptional 26.6% |
| Immigrants | Israel | 99.9 /100 | #37 | Exceptional 26.6% |
| Immigrants | Fiji | 99.9 /100 | #38 | Exceptional 26.6% |
| Sri Lankans | 99.9 /100 | #39 | Exceptional 26.7% |
Demographics Similar to Dominicans by Single Mother Poverty
In terms of single mother poverty, the demographic groups most similar to Dominicans are Cherokee (34.5%, a difference of 0.11%), Hopi (34.5%, a difference of 0.12%), Chickasaw (34.4%, a difference of 0.20%), Immigrants from Dominican Republic (34.4%, a difference of 0.37%), and Central American Indian (34.3%, a difference of 0.45%).
| Demographics | Rating | Rank | Single Mother Poverty |
| Potawatomi | 0.0 /100 | #309 | Tragic 34.1% |
| Hondurans | 0.0 /100 | #310 | Tragic 34.2% |
| Alsatians | 0.0 /100 | #311 | Tragic 34.3% |
| Central American Indians | 0.0 /100 | #312 | Tragic 34.3% |
| Immigrants | Dominican Republic | 0.0 /100 | #313 | Tragic 34.4% |
| Chickasaw | 0.0 /100 | #314 | Tragic 34.4% |
| Hopi | 0.0 /100 | #315 | Tragic 34.5% |
| Dominicans | 0.0 /100 | #316 | Tragic 34.5% |
| Cherokee | 0.0 /100 | #317 | Tragic 34.5% |
| Immigrants | Honduras | 0.0 /100 | #318 | Tragic 34.7% |
| Chippewa | 0.0 /100 | #319 | Tragic 34.8% |
| Iroquois | 0.0 /100 | #320 | Tragic 34.8% |
| Paiute | 0.0 /100 | #321 | Tragic 35.1% |
| Blacks/African Americans | 0.0 /100 | #322 | Tragic 35.2% |
| Kiowa | 0.0 /100 | #323 | Tragic 35.5% |