Marshallese vs Dominican Single Mother Poverty
COMPARE
Marshallese
Dominican
Single Mother Poverty
Single Mother Poverty Comparison
Marshallese
Dominicans
32.1%
SINGLE MOTHER POVERTY
0.0/ 100
METRIC RATING
279th/ 347
METRIC RANK
34.5%
SINGLE MOTHER POVERTY
0.0/ 100
METRIC RATING
316th/ 347
METRIC RANK
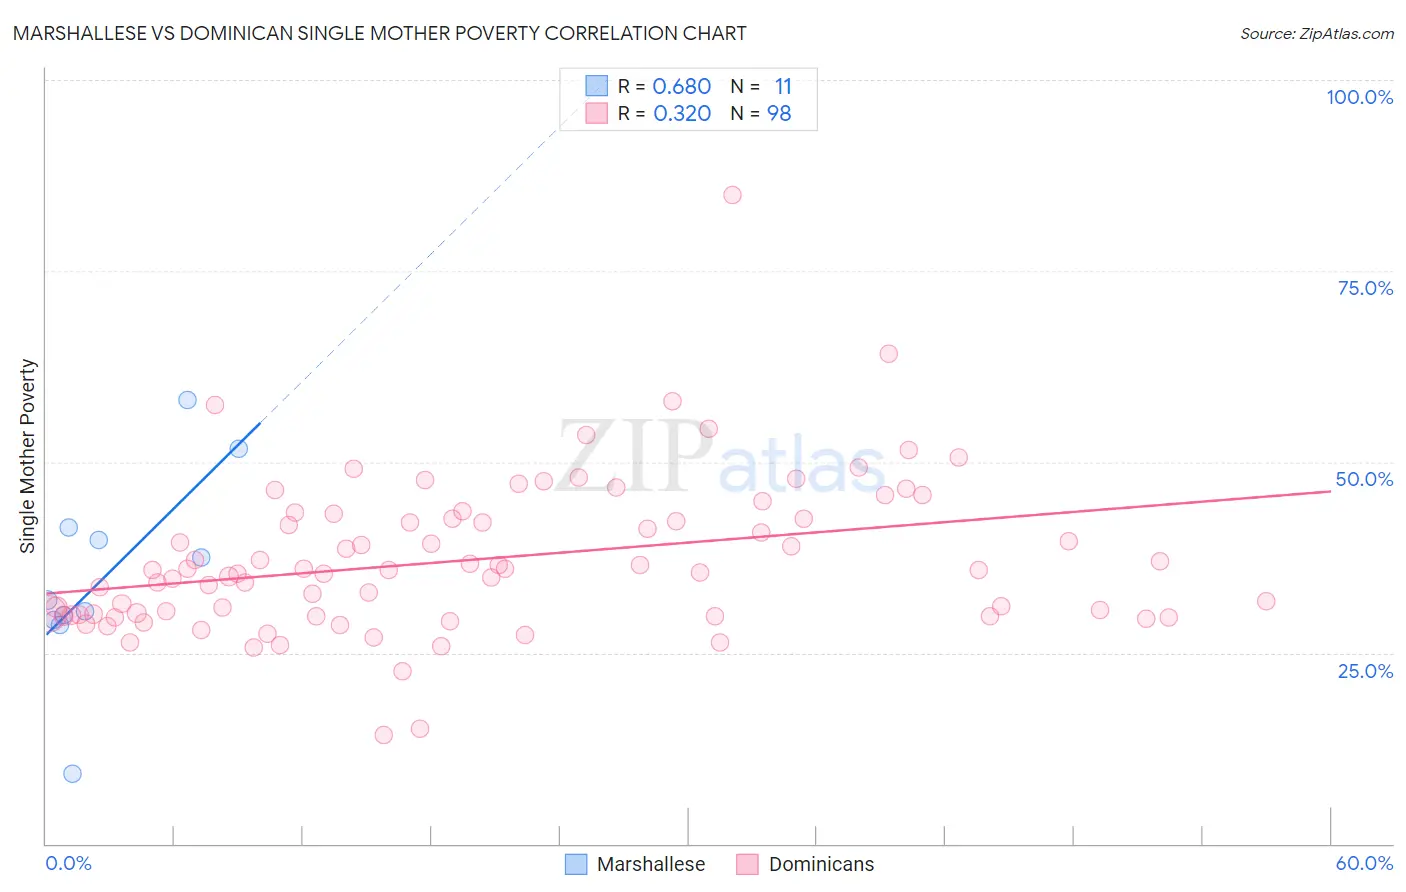
Marshallese vs Dominican Single Mother Poverty Correlation Chart
The statistical analysis conducted on geographies consisting of 14,718,372 people shows a significant positive correlation between the proportion of Marshallese and poverty level among single mothers in the United States with a correlation coefficient (R) of 0.680 and weighted average of 32.1%. Similarly, the statistical analysis conducted on geographies consisting of 347,165,672 people shows a mild positive correlation between the proportion of Dominicans and poverty level among single mothers in the United States with a correlation coefficient (R) of 0.320 and weighted average of 34.5%, a difference of 7.4%.
Single Mother Poverty Correlation Summary
| Measurement | Marshallese | Dominican |
| Minimum | 9.1% | 14.2% |
| Maximum | 58.1% | 84.9% |
| Range | 49.0% | 70.7% |
| Mean | 35.3% | 37.2% |
| Median | 31.9% | 35.8% |
| Interquartile 25% (IQ1) | 29.2% | 30.0% |
| Interquartile 75% (IQ3) | 41.5% | 42.5% |
| Interquartile Range (IQR) | 12.3% | 12.6% |
| Standard Deviation (Sample) | 13.0% | 10.2% |
| Standard Deviation (Population) | 12.4% | 10.1% |
Similar Demographics by Single Mother Poverty
Demographics Similar to Marshallese by Single Mother Poverty
In terms of single mother poverty, the demographic groups most similar to Marshallese are Nonimmigrants (32.2%, a difference of 0.22%), Cree (32.2%, a difference of 0.24%), Immigrants from the Azores (32.2%, a difference of 0.36%), Immigrants from Zaire (32.0%, a difference of 0.40%), and Spanish American (32.3%, a difference of 0.61%).
| Demographics | Rating | Rank | Single Mother Poverty |
| Immigrants | Micronesia | 0.1 /100 | #272 | Tragic 31.6% |
| Fijians | 0.1 /100 | #273 | Tragic 31.6% |
| Bangladeshis | 0.1 /100 | #274 | Tragic 31.7% |
| Central Americans | 0.1 /100 | #275 | Tragic 31.8% |
| Delaware | 0.0 /100 | #276 | Tragic 31.8% |
| Mexican American Indians | 0.0 /100 | #277 | Tragic 31.9% |
| Immigrants | Zaire | 0.0 /100 | #278 | Tragic 32.0% |
| Marshallese | 0.0 /100 | #279 | Tragic 32.1% |
| Immigrants | Nonimmigrants | 0.0 /100 | #280 | Tragic 32.2% |
| Cree | 0.0 /100 | #281 | Tragic 32.2% |
| Immigrants | Azores | 0.0 /100 | #282 | Tragic 32.2% |
| Spanish Americans | 0.0 /100 | #283 | Tragic 32.3% |
| Indonesians | 0.0 /100 | #284 | Tragic 32.4% |
| Immigrants | Latin America | 0.0 /100 | #285 | Tragic 32.4% |
| Yup'ik | 0.0 /100 | #286 | Tragic 32.5% |
Demographics Similar to Dominicans by Single Mother Poverty
In terms of single mother poverty, the demographic groups most similar to Dominicans are Cherokee (34.5%, a difference of 0.11%), Hopi (34.5%, a difference of 0.12%), Chickasaw (34.4%, a difference of 0.20%), Immigrants from Dominican Republic (34.4%, a difference of 0.37%), and Central American Indian (34.3%, a difference of 0.45%).
| Demographics | Rating | Rank | Single Mother Poverty |
| Potawatomi | 0.0 /100 | #309 | Tragic 34.1% |
| Hondurans | 0.0 /100 | #310 | Tragic 34.2% |
| Alsatians | 0.0 /100 | #311 | Tragic 34.3% |
| Central American Indians | 0.0 /100 | #312 | Tragic 34.3% |
| Immigrants | Dominican Republic | 0.0 /100 | #313 | Tragic 34.4% |
| Chickasaw | 0.0 /100 | #314 | Tragic 34.4% |
| Hopi | 0.0 /100 | #315 | Tragic 34.5% |
| Dominicans | 0.0 /100 | #316 | Tragic 34.5% |
| Cherokee | 0.0 /100 | #317 | Tragic 34.5% |
| Immigrants | Honduras | 0.0 /100 | #318 | Tragic 34.7% |
| Chippewa | 0.0 /100 | #319 | Tragic 34.8% |
| Iroquois | 0.0 /100 | #320 | Tragic 34.8% |
| Paiute | 0.0 /100 | #321 | Tragic 35.1% |
| Blacks/African Americans | 0.0 /100 | #322 | Tragic 35.2% |
| Kiowa | 0.0 /100 | #323 | Tragic 35.5% |