Senegalese vs Dominican Single Mother Poverty
COMPARE
Senegalese
Dominican
Single Mother Poverty
Single Mother Poverty Comparison
Senegalese
Dominicans
31.0%
SINGLE MOTHER POVERTY
0.5/ 100
METRIC RATING
254th/ 347
METRIC RANK
34.5%
SINGLE MOTHER POVERTY
0.0/ 100
METRIC RATING
316th/ 347
METRIC RANK
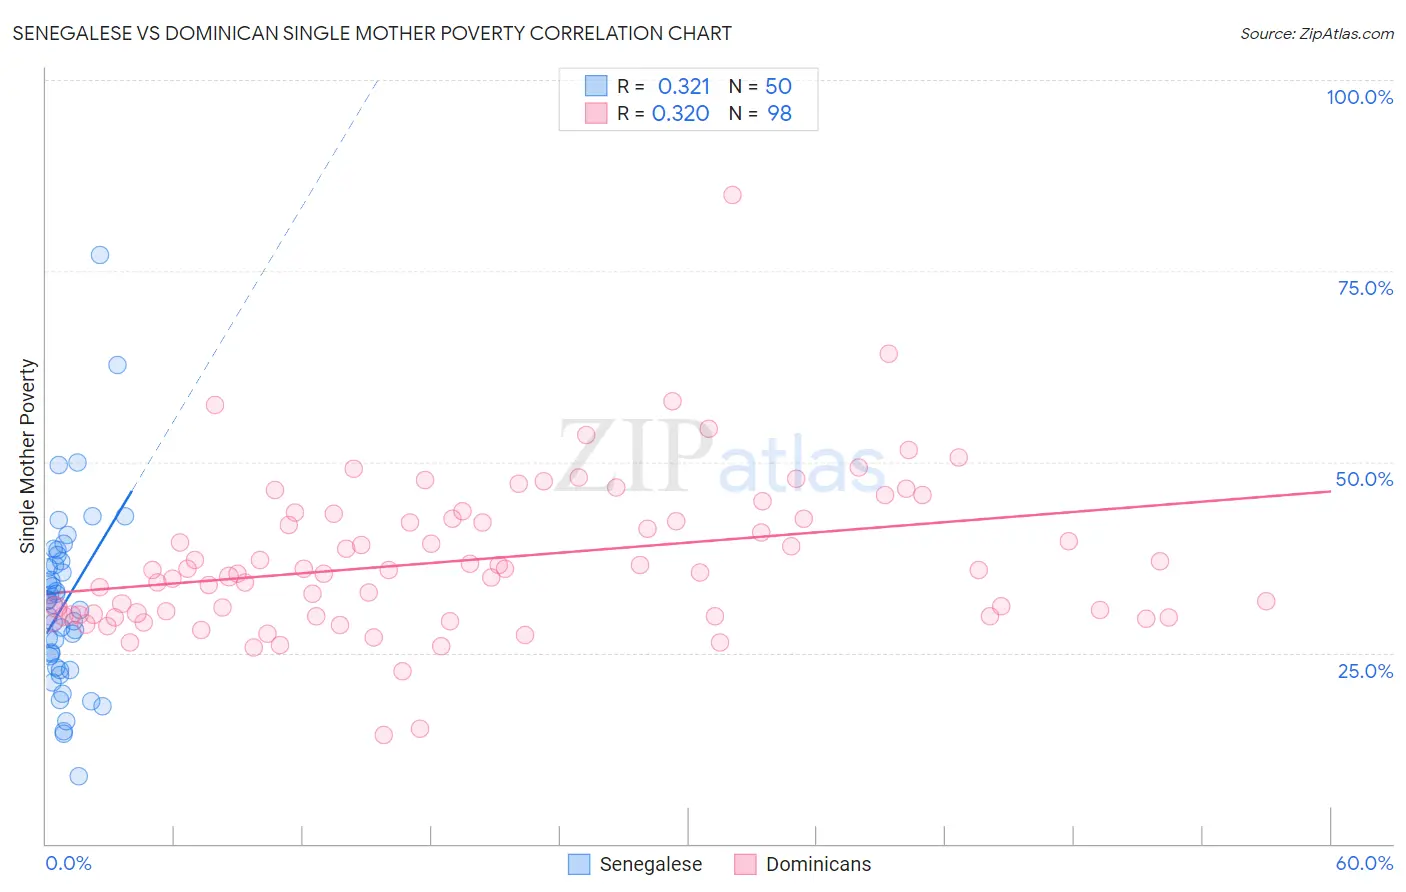
Senegalese vs Dominican Single Mother Poverty Correlation Chart
The statistical analysis conducted on geographies consisting of 77,710,183 people shows a mild positive correlation between the proportion of Senegalese and poverty level among single mothers in the United States with a correlation coefficient (R) of 0.321 and weighted average of 31.0%. Similarly, the statistical analysis conducted on geographies consisting of 347,165,672 people shows a mild positive correlation between the proportion of Dominicans and poverty level among single mothers in the United States with a correlation coefficient (R) of 0.320 and weighted average of 34.5%, a difference of 11.3%.
Single Mother Poverty Correlation Summary
| Measurement | Senegalese | Dominican |
| Minimum | 8.8% | 14.2% |
| Maximum | 77.0% | 84.9% |
| Range | 68.2% | 70.7% |
| Mean | 31.5% | 37.2% |
| Median | 30.9% | 35.8% |
| Interquartile 25% (IQ1) | 23.0% | 30.0% |
| Interquartile 75% (IQ3) | 36.9% | 42.5% |
| Interquartile Range (IQR) | 13.9% | 12.6% |
| Standard Deviation (Sample) | 12.1% | 10.2% |
| Standard Deviation (Population) | 11.9% | 10.1% |
Similar Demographics by Single Mother Poverty
Demographics Similar to Senegalese by Single Mother Poverty
In terms of single mother poverty, the demographic groups most similar to Senegalese are Belizean (31.0%, a difference of 0.11%), Celtic (30.9%, a difference of 0.14%), Tlingit-Haida (30.9%, a difference of 0.18%), Alaska Native (30.9%, a difference of 0.18%), and Vietnamese (30.9%, a difference of 0.31%).
| Demographics | Rating | Rank | Single Mother Poverty |
| West Indians | 0.9 /100 | #247 | Tragic 30.8% |
| French Canadians | 0.9 /100 | #248 | Tragic 30.8% |
| Cape Verdeans | 0.8 /100 | #249 | Tragic 30.8% |
| Vietnamese | 0.7 /100 | #250 | Tragic 30.9% |
| Tlingit-Haida | 0.6 /100 | #251 | Tragic 30.9% |
| Alaska Natives | 0.6 /100 | #252 | Tragic 30.9% |
| Celtics | 0.6 /100 | #253 | Tragic 30.9% |
| Senegalese | 0.5 /100 | #254 | Tragic 31.0% |
| Belizeans | 0.5 /100 | #255 | Tragic 31.0% |
| Immigrants | West Indies | 0.4 /100 | #256 | Tragic 31.1% |
| Immigrants | Bahamas | 0.4 /100 | #257 | Tragic 31.1% |
| Immigrants | Caribbean | 0.4 /100 | #258 | Tragic 31.1% |
| Immigrants | Bangladesh | 0.4 /100 | #259 | Tragic 31.1% |
| Whites/Caucasians | 0.3 /100 | #260 | Tragic 31.2% |
| Immigrants | El Salvador | 0.3 /100 | #261 | Tragic 31.2% |
Demographics Similar to Dominicans by Single Mother Poverty
In terms of single mother poverty, the demographic groups most similar to Dominicans are Cherokee (34.5%, a difference of 0.11%), Hopi (34.5%, a difference of 0.12%), Chickasaw (34.4%, a difference of 0.20%), Immigrants from Dominican Republic (34.4%, a difference of 0.37%), and Central American Indian (34.3%, a difference of 0.45%).
| Demographics | Rating | Rank | Single Mother Poverty |
| Potawatomi | 0.0 /100 | #309 | Tragic 34.1% |
| Hondurans | 0.0 /100 | #310 | Tragic 34.2% |
| Alsatians | 0.0 /100 | #311 | Tragic 34.3% |
| Central American Indians | 0.0 /100 | #312 | Tragic 34.3% |
| Immigrants | Dominican Republic | 0.0 /100 | #313 | Tragic 34.4% |
| Chickasaw | 0.0 /100 | #314 | Tragic 34.4% |
| Hopi | 0.0 /100 | #315 | Tragic 34.5% |
| Dominicans | 0.0 /100 | #316 | Tragic 34.5% |
| Cherokee | 0.0 /100 | #317 | Tragic 34.5% |
| Immigrants | Honduras | 0.0 /100 | #318 | Tragic 34.7% |
| Chippewa | 0.0 /100 | #319 | Tragic 34.8% |
| Iroquois | 0.0 /100 | #320 | Tragic 34.8% |
| Paiute | 0.0 /100 | #321 | Tragic 35.1% |
| Blacks/African Americans | 0.0 /100 | #322 | Tragic 35.2% |
| Kiowa | 0.0 /100 | #323 | Tragic 35.5% |