Iranian vs Belizean Associate's Degree
COMPARE
Iranian
Belizean
Associate's Degree
Associate's Degree Comparison
Iranians
Belizeans
58.2%
ASSOCIATE'S DEGREE
100.0/ 100
METRIC RATING
5th/ 347
METRIC RANK
40.6%
ASSOCIATE'S DEGREE
0.1/ 100
METRIC RATING
272nd/ 347
METRIC RANK
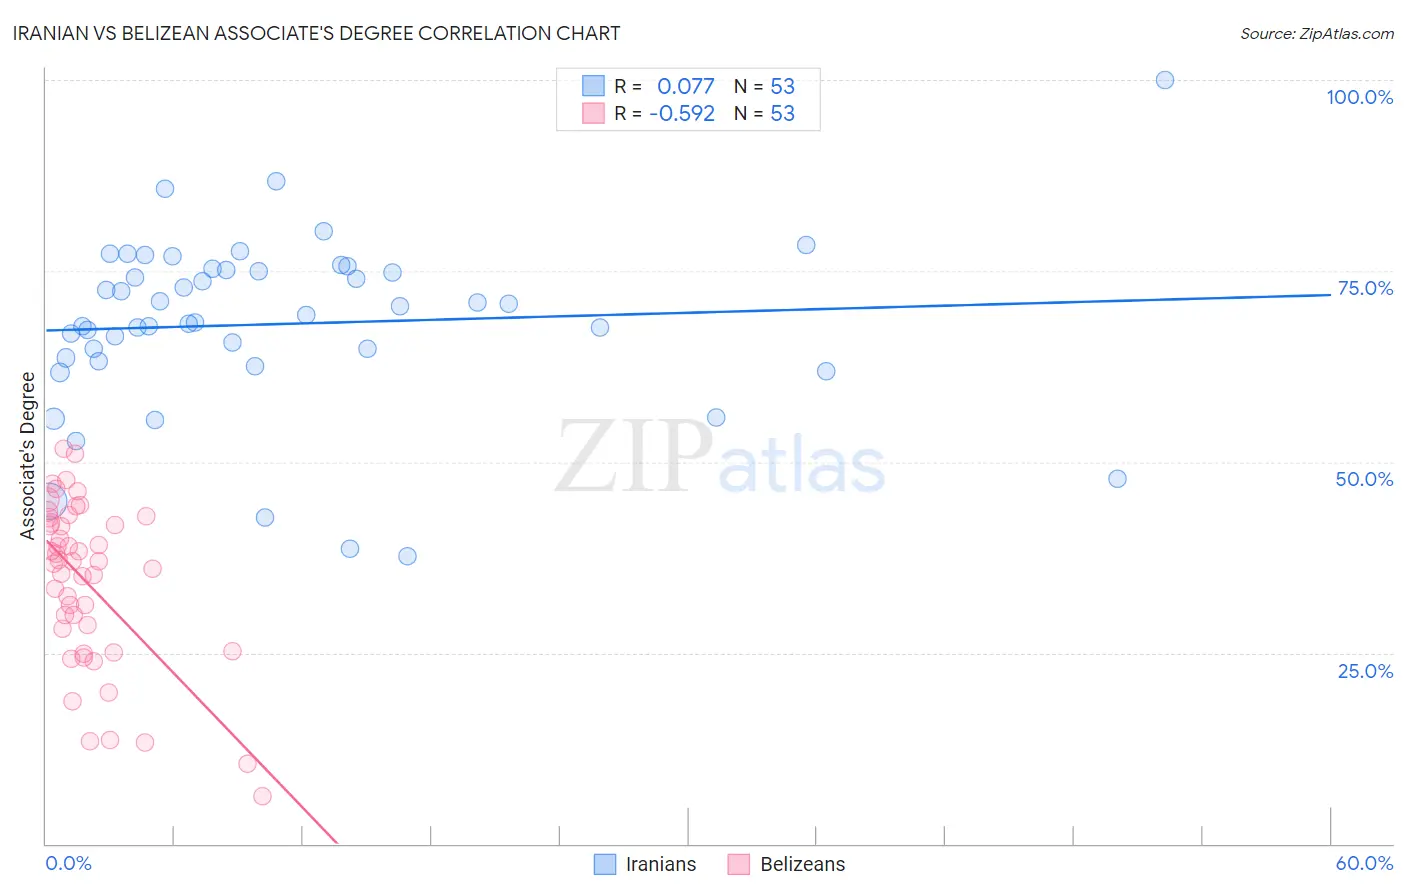
Iranian vs Belizean Associate's Degree Correlation Chart
The statistical analysis conducted on geographies consisting of 316,879,465 people shows a slight positive correlation between the proportion of Iranians and percentage of population with at least associate's degree education in the United States with a correlation coefficient (R) of 0.077 and weighted average of 58.2%. Similarly, the statistical analysis conducted on geographies consisting of 144,216,581 people shows a substantial negative correlation between the proportion of Belizeans and percentage of population with at least associate's degree education in the United States with a correlation coefficient (R) of -0.592 and weighted average of 40.6%, a difference of 43.1%.
Associate's Degree Correlation Summary
| Measurement | Iranian | Belizean |
| Minimum | 37.7% | 6.2% |
| Maximum | 100.0% | 51.7% |
| Range | 62.3% | 45.5% |
| Mean | 68.1% | 34.2% |
| Median | 69.2% | 37.0% |
| Interquartile 25% (IQ1) | 63.4% | 26.6% |
| Interquartile 75% (IQ3) | 75.2% | 42.4% |
| Interquartile Range (IQR) | 11.8% | 15.7% |
| Standard Deviation (Sample) | 11.7% | 10.8% |
| Standard Deviation (Population) | 11.6% | 10.7% |
Similar Demographics by Associate's Degree
Demographics Similar to Iranians by Associate's Degree
In terms of associate's degree, the demographic groups most similar to Iranians are Immigrants from Taiwan (58.4%, a difference of 0.41%), Immigrants from India (58.5%, a difference of 0.66%), Okinawan (57.7%, a difference of 0.83%), Immigrants from Iran (57.7%, a difference of 0.89%), and Thai (57.4%, a difference of 1.3%).
| Demographics | Rating | Rank | Associate's Degree |
| Filipinos | 100.0 /100 | #1 | Exceptional 59.8% |
| Immigrants | Singapore | 100.0 /100 | #2 | Exceptional 58.9% |
| Immigrants | India | 100.0 /100 | #3 | Exceptional 58.5% |
| Immigrants | Taiwan | 100.0 /100 | #4 | Exceptional 58.4% |
| Iranians | 100.0 /100 | #5 | Exceptional 58.2% |
| Okinawans | 100.0 /100 | #6 | Exceptional 57.7% |
| Immigrants | Iran | 100.0 /100 | #7 | Exceptional 57.7% |
| Thais | 100.0 /100 | #8 | Exceptional 57.4% |
| Immigrants | Israel | 100.0 /100 | #9 | Exceptional 56.8% |
| Cypriots | 100.0 /100 | #10 | Exceptional 56.4% |
| Immigrants | Australia | 100.0 /100 | #11 | Exceptional 55.8% |
| Immigrants | South Central Asia | 100.0 /100 | #12 | Exceptional 55.7% |
| Immigrants | China | 100.0 /100 | #13 | Exceptional 55.5% |
| Immigrants | Hong Kong | 100.0 /100 | #14 | Exceptional 55.4% |
| Immigrants | Eastern Asia | 100.0 /100 | #15 | Exceptional 55.4% |
Demographics Similar to Belizeans by Associate's Degree
In terms of associate's degree, the demographic groups most similar to Belizeans are Immigrants from Laos (40.7%, a difference of 0.070%), Chippewa (40.7%, a difference of 0.25%), Puget Sound Salish (40.5%, a difference of 0.29%), American (40.8%, a difference of 0.30%), and Immigrants from Dominica (40.5%, a difference of 0.43%).
| Demographics | Rating | Rank | Associate's Degree |
| Africans | 0.2 /100 | #265 | Tragic 41.1% |
| Samoans | 0.2 /100 | #266 | Tragic 41.1% |
| Hawaiians | 0.2 /100 | #267 | Tragic 40.9% |
| Central American Indians | 0.2 /100 | #268 | Tragic 40.8% |
| Americans | 0.2 /100 | #269 | Tragic 40.8% |
| Chippewa | 0.2 /100 | #270 | Tragic 40.7% |
| Immigrants | Laos | 0.1 /100 | #271 | Tragic 40.7% |
| Belizeans | 0.1 /100 | #272 | Tragic 40.6% |
| Puget Sound Salish | 0.1 /100 | #273 | Tragic 40.5% |
| Immigrants | Dominica | 0.1 /100 | #274 | Tragic 40.5% |
| Potawatomi | 0.1 /100 | #275 | Tragic 40.4% |
| Puerto Ricans | 0.1 /100 | #276 | Tragic 40.4% |
| Blackfeet | 0.1 /100 | #277 | Tragic 40.3% |
| Ottawa | 0.1 /100 | #278 | Tragic 40.3% |
| Immigrants | Nicaragua | 0.1 /100 | #279 | Tragic 40.3% |