Immigrants from Serbia vs Belizean Single Mother Poverty
COMPARE
Immigrants from Serbia
Belizean
Single Mother Poverty
Single Mother Poverty Comparison
Immigrants from Serbia
Belizeans
26.9%
SINGLE MOTHER POVERTY
99.9/ 100
METRIC RATING
46th/ 347
METRIC RANK
31.0%
SINGLE MOTHER POVERTY
0.5/ 100
METRIC RATING
255th/ 347
METRIC RANK
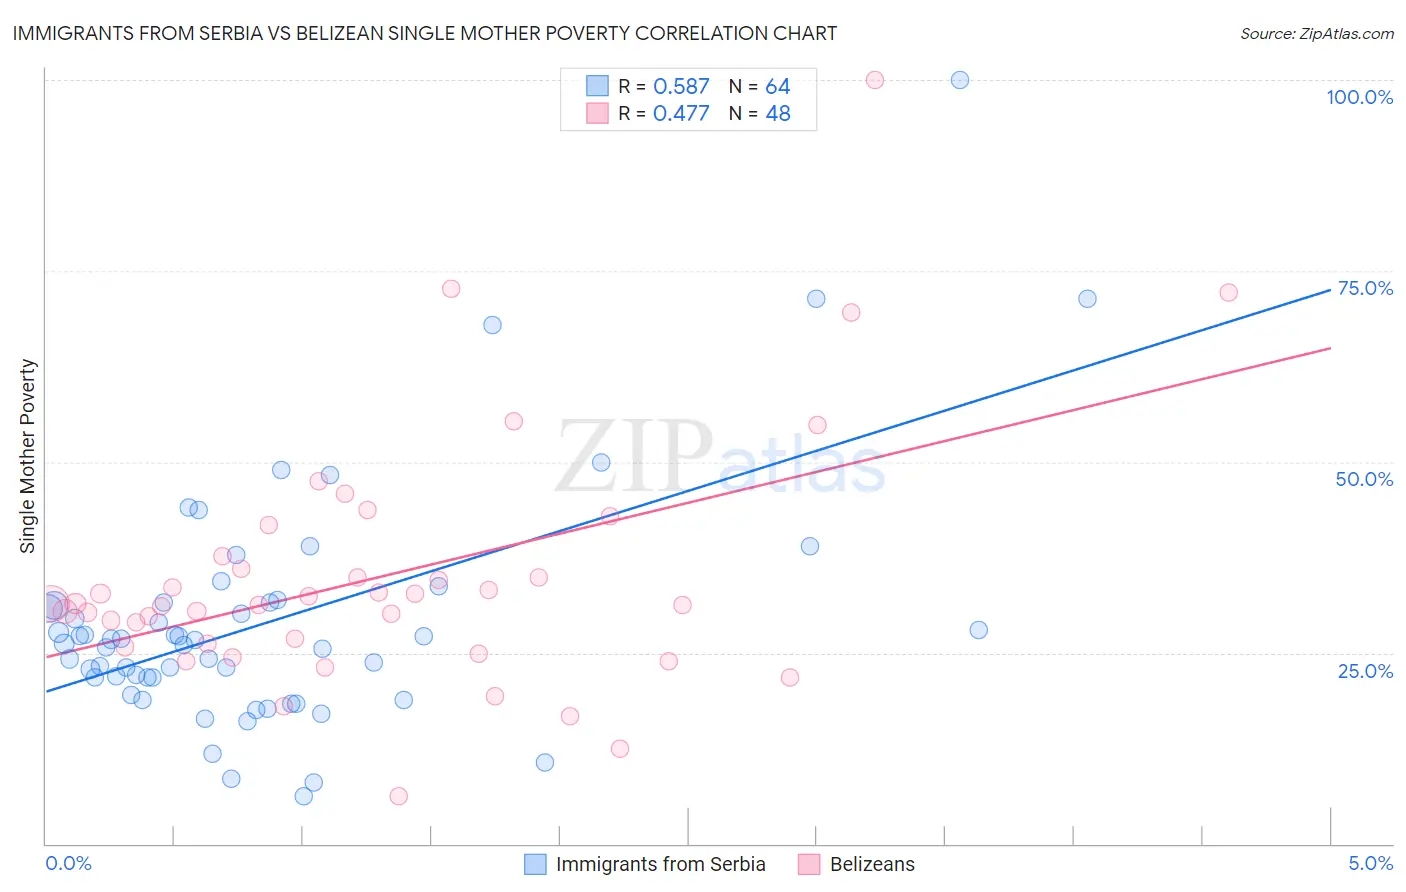
Immigrants from Serbia vs Belizean Single Mother Poverty Correlation Chart
The statistical analysis conducted on geographies consisting of 130,174,648 people shows a substantial positive correlation between the proportion of Immigrants from Serbia and poverty level among single mothers in the United States with a correlation coefficient (R) of 0.587 and weighted average of 26.9%. Similarly, the statistical analysis conducted on geographies consisting of 143,389,155 people shows a moderate positive correlation between the proportion of Belizeans and poverty level among single mothers in the United States with a correlation coefficient (R) of 0.477 and weighted average of 31.0%, a difference of 15.3%.
Single Mother Poverty Correlation Summary
| Measurement | Immigrants from Serbia | Belizean |
| Minimum | 6.2% | 6.2% |
| Maximum | 100.0% | 100.0% |
| Range | 93.8% | 93.8% |
| Mean | 29.2% | 35.0% |
| Median | 26.4% | 31.4% |
| Interquartile 25% (IQ1) | 21.8% | 26.0% |
| Interquartile 75% (IQ3) | 31.6% | 36.8% |
| Interquartile Range (IQR) | 9.8% | 10.9% |
| Standard Deviation (Sample) | 15.9% | 16.6% |
| Standard Deviation (Population) | 15.8% | 16.5% |
Similar Demographics by Single Mother Poverty
Demographics Similar to Immigrants from Serbia by Single Mother Poverty
In terms of single mother poverty, the demographic groups most similar to Immigrants from Serbia are Latvian (26.9%, a difference of 0.040%), Egyptian (26.9%, a difference of 0.060%), Immigrants from Sierra Leone (26.9%, a difference of 0.12%), Immigrants from Poland (26.9%, a difference of 0.13%), and Cambodian (27.0%, a difference of 0.22%).
| Demographics | Rating | Rank | Single Mother Poverty |
| Sri Lankans | 99.9 /100 | #39 | Exceptional 26.7% |
| Immigrants | Vietnam | 99.9 /100 | #40 | Exceptional 26.7% |
| Immigrants | Greece | 99.9 /100 | #41 | Exceptional 26.7% |
| Armenians | 99.9 /100 | #42 | Exceptional 26.8% |
| Tsimshian | 99.9 /100 | #43 | Exceptional 26.8% |
| Immigrants | Sierra Leone | 99.9 /100 | #44 | Exceptional 26.9% |
| Latvians | 99.9 /100 | #45 | Exceptional 26.9% |
| Immigrants | Serbia | 99.9 /100 | #46 | Exceptional 26.9% |
| Egyptians | 99.8 /100 | #47 | Exceptional 26.9% |
| Immigrants | Poland | 99.8 /100 | #48 | Exceptional 26.9% |
| Cambodians | 99.8 /100 | #49 | Exceptional 27.0% |
| Laotians | 99.8 /100 | #50 | Exceptional 27.0% |
| Immigrants | Argentina | 99.7 /100 | #51 | Exceptional 27.1% |
| Immigrants | South Eastern Asia | 99.7 /100 | #52 | Exceptional 27.1% |
| Immigrants | Jordan | 99.7 /100 | #53 | Exceptional 27.1% |
Demographics Similar to Belizeans by Single Mother Poverty
In terms of single mother poverty, the demographic groups most similar to Belizeans are Senegalese (31.0%, a difference of 0.11%), Immigrants from West Indies (31.1%, a difference of 0.21%), Celtic (30.9%, a difference of 0.25%), Immigrants from Bahamas (31.1%, a difference of 0.26%), and Alaska Native (30.9%, a difference of 0.28%).
| Demographics | Rating | Rank | Single Mother Poverty |
| French Canadians | 0.9 /100 | #248 | Tragic 30.8% |
| Cape Verdeans | 0.8 /100 | #249 | Tragic 30.8% |
| Vietnamese | 0.7 /100 | #250 | Tragic 30.9% |
| Tlingit-Haida | 0.6 /100 | #251 | Tragic 30.9% |
| Alaska Natives | 0.6 /100 | #252 | Tragic 30.9% |
| Celtics | 0.6 /100 | #253 | Tragic 30.9% |
| Senegalese | 0.5 /100 | #254 | Tragic 31.0% |
| Belizeans | 0.5 /100 | #255 | Tragic 31.0% |
| Immigrants | West Indies | 0.4 /100 | #256 | Tragic 31.1% |
| Immigrants | Bahamas | 0.4 /100 | #257 | Tragic 31.1% |
| Immigrants | Caribbean | 0.4 /100 | #258 | Tragic 31.1% |
| Immigrants | Bangladesh | 0.4 /100 | #259 | Tragic 31.1% |
| Whites/Caucasians | 0.3 /100 | #260 | Tragic 31.2% |
| Immigrants | El Salvador | 0.3 /100 | #261 | Tragic 31.2% |
| Hmong | 0.3 /100 | #262 | Tragic 31.2% |