Iranian vs Belizean Single Father Households
COMPARE
Iranian
Belizean
Single Father Households
Single Father Households Comparison
Iranians
Belizeans
1.9%
SINGLE FATHER HOUSEHOLDS
100.0/ 100
METRIC RATING
19th/ 347
METRIC RANK
2.6%
SINGLE FATHER HOUSEHOLDS
0.2/ 100
METRIC RATING
272nd/ 347
METRIC RANK
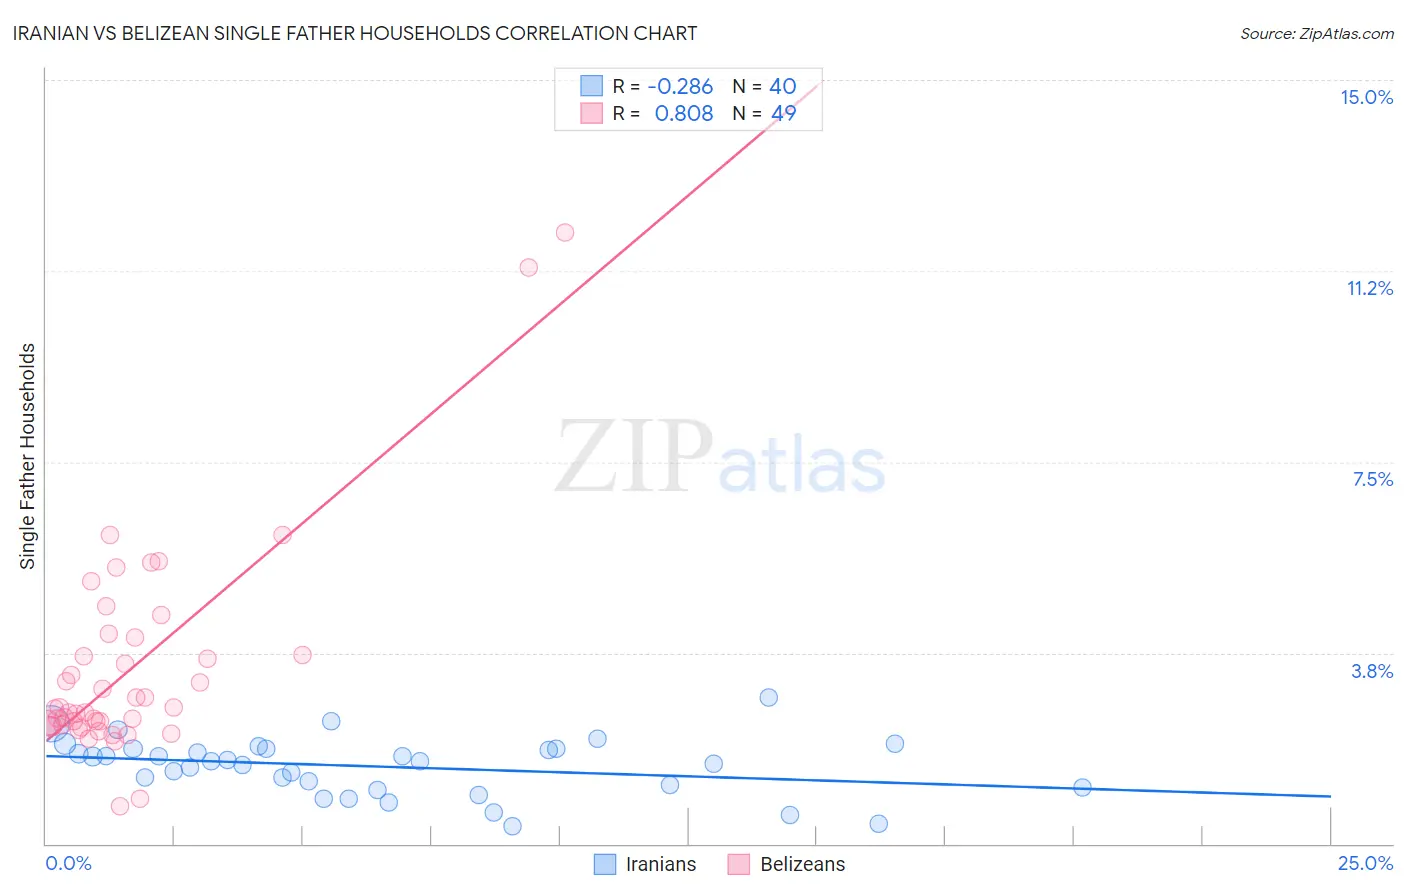
Iranian vs Belizean Single Father Households Correlation Chart
The statistical analysis conducted on geographies consisting of 314,844,289 people shows a weak negative correlation between the proportion of Iranians and percentage of single father households in the United States with a correlation coefficient (R) of -0.286 and weighted average of 1.9%. Similarly, the statistical analysis conducted on geographies consisting of 143,901,350 people shows a very strong positive correlation between the proportion of Belizeans and percentage of single father households in the United States with a correlation coefficient (R) of 0.808 and weighted average of 2.6%, a difference of 35.4%.
Single Father Households Correlation Summary
| Measurement | Iranian | Belizean |
| Minimum | 0.34% | 0.75% |
| Maximum | 2.9% | 12.0% |
| Range | 2.5% | 11.3% |
| Mean | 1.5% | 3.4% |
| Median | 1.6% | 2.6% |
| Interquartile 25% (IQ1) | 1.1% | 2.3% |
| Interquartile 75% (IQ3) | 1.9% | 3.9% |
| Interquartile Range (IQR) | 0.73% | 1.6% |
| Standard Deviation (Sample) | 0.56% | 2.1% |
| Standard Deviation (Population) | 0.55% | 2.1% |
Similar Demographics by Single Father Households
Demographics Similar to Iranians by Single Father Households
In terms of single father households, the demographic groups most similar to Iranians are Thai (1.9%, a difference of 0.070%), Immigrants from Albania (1.9%, a difference of 0.37%), Immigrants from Latvia (1.9%, a difference of 0.56%), Indian (Asian) (1.9%, a difference of 0.84%), and Immigrants from India (1.9%, a difference of 1.3%).
| Demographics | Rating | Rank | Single Father Households |
| Immigrants | Greece | 100.0 /100 | #12 | Exceptional 1.9% |
| Immigrants | Singapore | 100.0 /100 | #13 | Exceptional 1.9% |
| Immigrants | Lithuania | 100.0 /100 | #14 | Exceptional 1.9% |
| Immigrants | Eastern Asia | 100.0 /100 | #15 | Exceptional 1.9% |
| Immigrants | Iran | 100.0 /100 | #16 | Exceptional 1.9% |
| Immigrants | India | 100.0 /100 | #17 | Exceptional 1.9% |
| Indians (Asian) | 100.0 /100 | #18 | Exceptional 1.9% |
| Iranians | 100.0 /100 | #19 | Exceptional 1.9% |
| Thais | 100.0 /100 | #20 | Exceptional 1.9% |
| Immigrants | Albania | 100.0 /100 | #21 | Exceptional 1.9% |
| Immigrants | Latvia | 100.0 /100 | #22 | Exceptional 1.9% |
| Immigrants | Croatia | 100.0 /100 | #23 | Exceptional 2.0% |
| Immigrants | Russia | 100.0 /100 | #24 | Exceptional 2.0% |
| Eastern Europeans | 100.0 /100 | #25 | Exceptional 2.0% |
| Assyrians/Chaldeans/Syriacs | 100.0 /100 | #26 | Exceptional 2.0% |
Demographics Similar to Belizeans by Single Father Households
In terms of single father households, the demographic groups most similar to Belizeans are Creek (2.6%, a difference of 0.0%), Iroquois (2.6%, a difference of 0.040%), Puerto Rican (2.6%, a difference of 0.070%), Seminole (2.6%, a difference of 0.37%), and Immigrants from Dominican Republic (2.6%, a difference of 0.49%).
| Demographics | Rating | Rank | Single Father Households |
| Immigrants | Micronesia | 0.5 /100 | #265 | Tragic 2.6% |
| French American Indians | 0.5 /100 | #266 | Tragic 2.6% |
| Guamanians/Chamorros | 0.4 /100 | #267 | Tragic 2.6% |
| Haitians | 0.4 /100 | #268 | Tragic 2.6% |
| Cubans | 0.3 /100 | #269 | Tragic 2.6% |
| Seminole | 0.3 /100 | #270 | Tragic 2.6% |
| Creek | 0.2 /100 | #271 | Tragic 2.6% |
| Belizeans | 0.2 /100 | #272 | Tragic 2.6% |
| Iroquois | 0.2 /100 | #273 | Tragic 2.6% |
| Puerto Ricans | 0.2 /100 | #274 | Tragic 2.6% |
| Immigrants | Dominican Republic | 0.2 /100 | #275 | Tragic 2.6% |
| Immigrants | Haiti | 0.1 /100 | #276 | Tragic 2.6% |
| Shoshone | 0.1 /100 | #277 | Tragic 2.6% |
| Cherokee | 0.1 /100 | #278 | Tragic 2.6% |
| Samoans | 0.1 /100 | #279 | Tragic 2.6% |