South American Indian vs Belizean Single Mother Poverty
COMPARE
South American Indian
Belizean
Single Mother Poverty
Single Mother Poverty Comparison
South American Indians
Belizeans
29.3%
SINGLE MOTHER POVERTY
43.2/ 100
METRIC RATING
178th/ 347
METRIC RANK
31.0%
SINGLE MOTHER POVERTY
0.5/ 100
METRIC RATING
255th/ 347
METRIC RANK
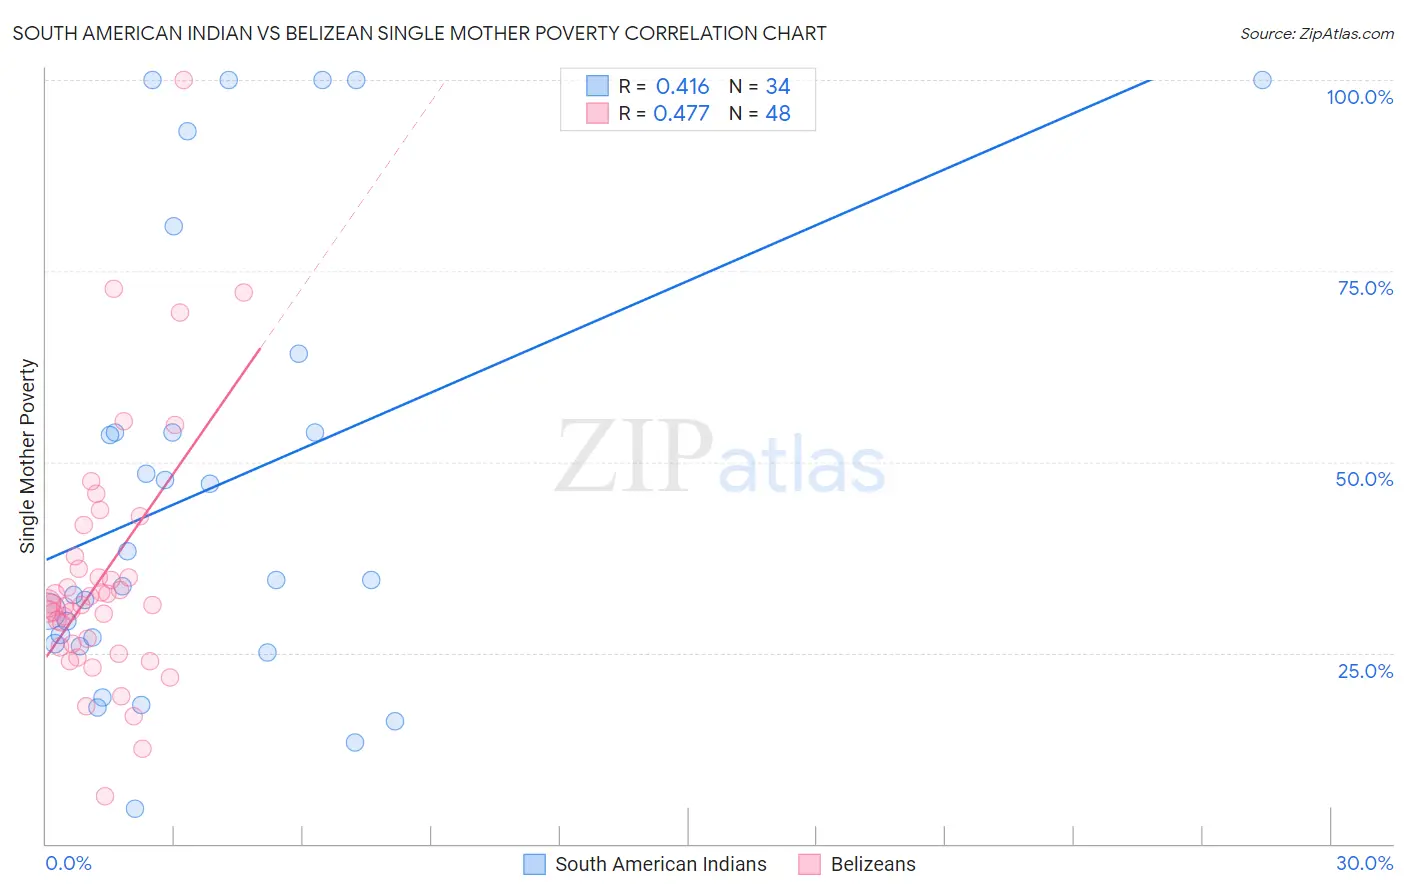
South American Indian vs Belizean Single Mother Poverty Correlation Chart
The statistical analysis conducted on geographies consisting of 163,070,605 people shows a moderate positive correlation between the proportion of South American Indians and poverty level among single mothers in the United States with a correlation coefficient (R) of 0.416 and weighted average of 29.3%. Similarly, the statistical analysis conducted on geographies consisting of 143,389,155 people shows a moderate positive correlation between the proportion of Belizeans and poverty level among single mothers in the United States with a correlation coefficient (R) of 0.477 and weighted average of 31.0%, a difference of 6.0%.
Single Mother Poverty Correlation Summary
| Measurement | South American Indian | Belizean |
| Minimum | 4.7% | 6.2% |
| Maximum | 100.0% | 100.0% |
| Range | 95.3% | 93.8% |
| Mean | 46.5% | 35.0% |
| Median | 34.5% | 31.4% |
| Interquartile 25% (IQ1) | 26.2% | 26.0% |
| Interquartile 75% (IQ3) | 53.9% | 36.8% |
| Interquartile Range (IQR) | 27.7% | 10.9% |
| Standard Deviation (Sample) | 29.1% | 16.6% |
| Standard Deviation (Population) | 28.6% | 16.5% |
Similar Demographics by Single Mother Poverty
Demographics Similar to South American Indians by Single Mother Poverty
In terms of single mother poverty, the demographic groups most similar to South American Indians are Immigrants from Uzbekistan (29.3%, a difference of 0.030%), Immigrants from Bosnia and Herzegovina (29.2%, a difference of 0.090%), Immigrants from Norway (29.3%, a difference of 0.090%), Canadian (29.3%, a difference of 0.14%), and Hawaiian (29.2%, a difference of 0.22%).
| Demographics | Rating | Rank | Single Mother Poverty |
| Puget Sound Salish | 55.1 /100 | #171 | Average 29.1% |
| Carpatho Rusyns | 53.8 /100 | #172 | Average 29.1% |
| British | 50.6 /100 | #173 | Average 29.2% |
| Immigrants | Saudi Arabia | 50.0 /100 | #174 | Average 29.2% |
| Immigrants | Costa Rica | 48.8 /100 | #175 | Average 29.2% |
| Hawaiians | 47.8 /100 | #176 | Average 29.2% |
| Immigrants | Bosnia and Herzegovina | 45.1 /100 | #177 | Average 29.2% |
| South American Indians | 43.2 /100 | #178 | Average 29.3% |
| Immigrants | Uzbekistan | 42.6 /100 | #179 | Average 29.3% |
| Immigrants | Norway | 41.5 /100 | #180 | Average 29.3% |
| Canadians | 40.4 /100 | #181 | Average 29.3% |
| Immigrants | Eastern Africa | 38.5 /100 | #182 | Fair 29.3% |
| Nepalese | 38.3 /100 | #183 | Fair 29.3% |
| Nigerians | 38.0 /100 | #184 | Fair 29.3% |
| Ghanaians | 36.8 /100 | #185 | Fair 29.4% |
Demographics Similar to Belizeans by Single Mother Poverty
In terms of single mother poverty, the demographic groups most similar to Belizeans are Senegalese (31.0%, a difference of 0.11%), Immigrants from West Indies (31.1%, a difference of 0.21%), Celtic (30.9%, a difference of 0.25%), Immigrants from Bahamas (31.1%, a difference of 0.26%), and Alaska Native (30.9%, a difference of 0.28%).
| Demographics | Rating | Rank | Single Mother Poverty |
| French Canadians | 0.9 /100 | #248 | Tragic 30.8% |
| Cape Verdeans | 0.8 /100 | #249 | Tragic 30.8% |
| Vietnamese | 0.7 /100 | #250 | Tragic 30.9% |
| Tlingit-Haida | 0.6 /100 | #251 | Tragic 30.9% |
| Alaska Natives | 0.6 /100 | #252 | Tragic 30.9% |
| Celtics | 0.6 /100 | #253 | Tragic 30.9% |
| Senegalese | 0.5 /100 | #254 | Tragic 31.0% |
| Belizeans | 0.5 /100 | #255 | Tragic 31.0% |
| Immigrants | West Indies | 0.4 /100 | #256 | Tragic 31.1% |
| Immigrants | Bahamas | 0.4 /100 | #257 | Tragic 31.1% |
| Immigrants | Caribbean | 0.4 /100 | #258 | Tragic 31.1% |
| Immigrants | Bangladesh | 0.4 /100 | #259 | Tragic 31.1% |
| Whites/Caucasians | 0.3 /100 | #260 | Tragic 31.2% |
| Immigrants | El Salvador | 0.3 /100 | #261 | Tragic 31.2% |
| Hmong | 0.3 /100 | #262 | Tragic 31.2% |