Jordanian vs African Single Mother Poverty
COMPARE
Jordanian
African
Single Mother Poverty
Single Mother Poverty Comparison
Jordanians
Africans
26.4%
SINGLE MOTHER POVERTY
100.0/ 100
METRIC RATING
29th/ 347
METRIC RANK
33.3%
SINGLE MOTHER POVERTY
0.0/ 100
METRIC RATING
298th/ 347
METRIC RANK
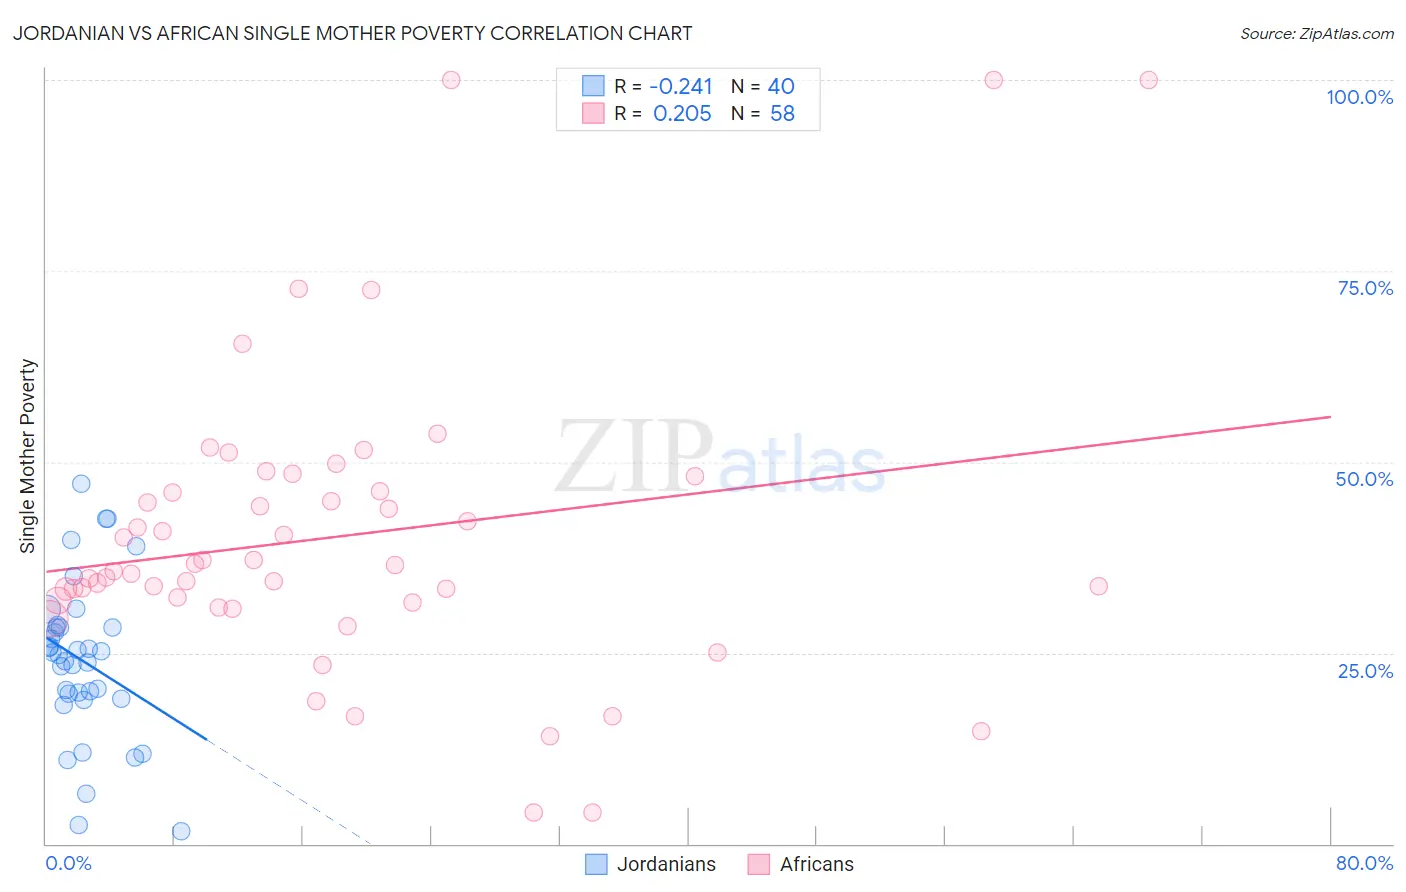
Jordanian vs African Single Mother Poverty Correlation Chart
The statistical analysis conducted on geographies consisting of 164,762,978 people shows a weak negative correlation between the proportion of Jordanians and poverty level among single mothers in the United States with a correlation coefficient (R) of -0.241 and weighted average of 26.4%. Similarly, the statistical analysis conducted on geographies consisting of 460,032,526 people shows a weak positive correlation between the proportion of Africans and poverty level among single mothers in the United States with a correlation coefficient (R) of 0.205 and weighted average of 33.3%, a difference of 26.0%.
Single Mother Poverty Correlation Summary
| Measurement | Jordanian | African |
| Minimum | 1.7% | 4.1% |
| Maximum | 47.1% | 100.0% |
| Range | 45.4% | 95.9% |
| Mean | 24.0% | 40.2% |
| Median | 24.9% | 36.1% |
| Interquartile 25% (IQ1) | 19.3% | 31.9% |
| Interquartile 75% (IQ3) | 28.3% | 46.1% |
| Interquartile Range (IQR) | 9.0% | 14.2% |
| Standard Deviation (Sample) | 10.2% | 19.5% |
| Standard Deviation (Population) | 10.1% | 19.3% |
Similar Demographics by Single Mother Poverty
Demographics Similar to Jordanians by Single Mother Poverty
In terms of single mother poverty, the demographic groups most similar to Jordanians are Korean (26.4%, a difference of 0.050%), Immigrants from Japan (26.4%, a difference of 0.070%), Turkish (26.4%, a difference of 0.090%), Immigrants from Philippines (26.5%, a difference of 0.24%), and Immigrants from Sri Lanka (26.3%, a difference of 0.29%).
| Demographics | Rating | Rank | Single Mother Poverty |
| Immigrants | Korea | 100.0 /100 | #22 | Exceptional 26.2% |
| Burmese | 100.0 /100 | #23 | Exceptional 26.2% |
| Immigrants | Moldova | 100.0 /100 | #24 | Exceptional 26.2% |
| Immigrants | Asia | 100.0 /100 | #25 | Exceptional 26.3% |
| Immigrants | Sri Lanka | 100.0 /100 | #26 | Exceptional 26.3% |
| Immigrants | Japan | 100.0 /100 | #27 | Exceptional 26.4% |
| Koreans | 100.0 /100 | #28 | Exceptional 26.4% |
| Jordanians | 100.0 /100 | #29 | Exceptional 26.4% |
| Turks | 100.0 /100 | #30 | Exceptional 26.4% |
| Immigrants | Philippines | 100.0 /100 | #31 | Exceptional 26.5% |
| Tongans | 99.9 /100 | #32 | Exceptional 26.5% |
| Bulgarians | 99.9 /100 | #33 | Exceptional 26.5% |
| Immigrants | Indonesia | 99.9 /100 | #34 | Exceptional 26.6% |
| Maltese | 99.9 /100 | #35 | Exceptional 26.6% |
| Okinawans | 99.9 /100 | #36 | Exceptional 26.6% |
Demographics Similar to Africans by Single Mother Poverty
In terms of single mother poverty, the demographic groups most similar to Africans are Immigrants from Guatemala (33.3%, a difference of 0.090%), Hispanic or Latino (33.3%, a difference of 0.090%), Pennsylvania German (33.2%, a difference of 0.11%), Blackfeet (33.2%, a difference of 0.25%), and Immigrants from Somalia (33.4%, a difference of 0.33%).
| Demographics | Rating | Rank | Single Mother Poverty |
| Guatemalans | 0.0 /100 | #291 | Tragic 32.9% |
| Shoshone | 0.0 /100 | #292 | Tragic 32.9% |
| Aleuts | 0.0 /100 | #293 | Tragic 32.9% |
| French American Indians | 0.0 /100 | #294 | Tragic 33.1% |
| Yaqui | 0.0 /100 | #295 | Tragic 33.1% |
| Blackfeet | 0.0 /100 | #296 | Tragic 33.2% |
| Pennsylvania Germans | 0.0 /100 | #297 | Tragic 33.2% |
| Africans | 0.0 /100 | #298 | Tragic 33.3% |
| Immigrants | Guatemala | 0.0 /100 | #299 | Tragic 33.3% |
| Hispanics or Latinos | 0.0 /100 | #300 | Tragic 33.3% |
| Immigrants | Somalia | 0.0 /100 | #301 | Tragic 33.4% |
| Arapaho | 0.0 /100 | #302 | Tragic 33.4% |
| Americans | 0.0 /100 | #303 | Tragic 33.5% |
| Mexicans | 0.0 /100 | #304 | Tragic 33.6% |
| Immigrants | Central America | 0.0 /100 | #305 | Tragic 33.6% |