Yup'ik vs African Single Mother Poverty
COMPARE
Yup'ik
African
Single Mother Poverty
Single Mother Poverty Comparison
Yup'ik
Africans
32.5%
SINGLE MOTHER POVERTY
0.0/ 100
METRIC RATING
286th/ 347
METRIC RANK
33.3%
SINGLE MOTHER POVERTY
0.0/ 100
METRIC RATING
298th/ 347
METRIC RANK
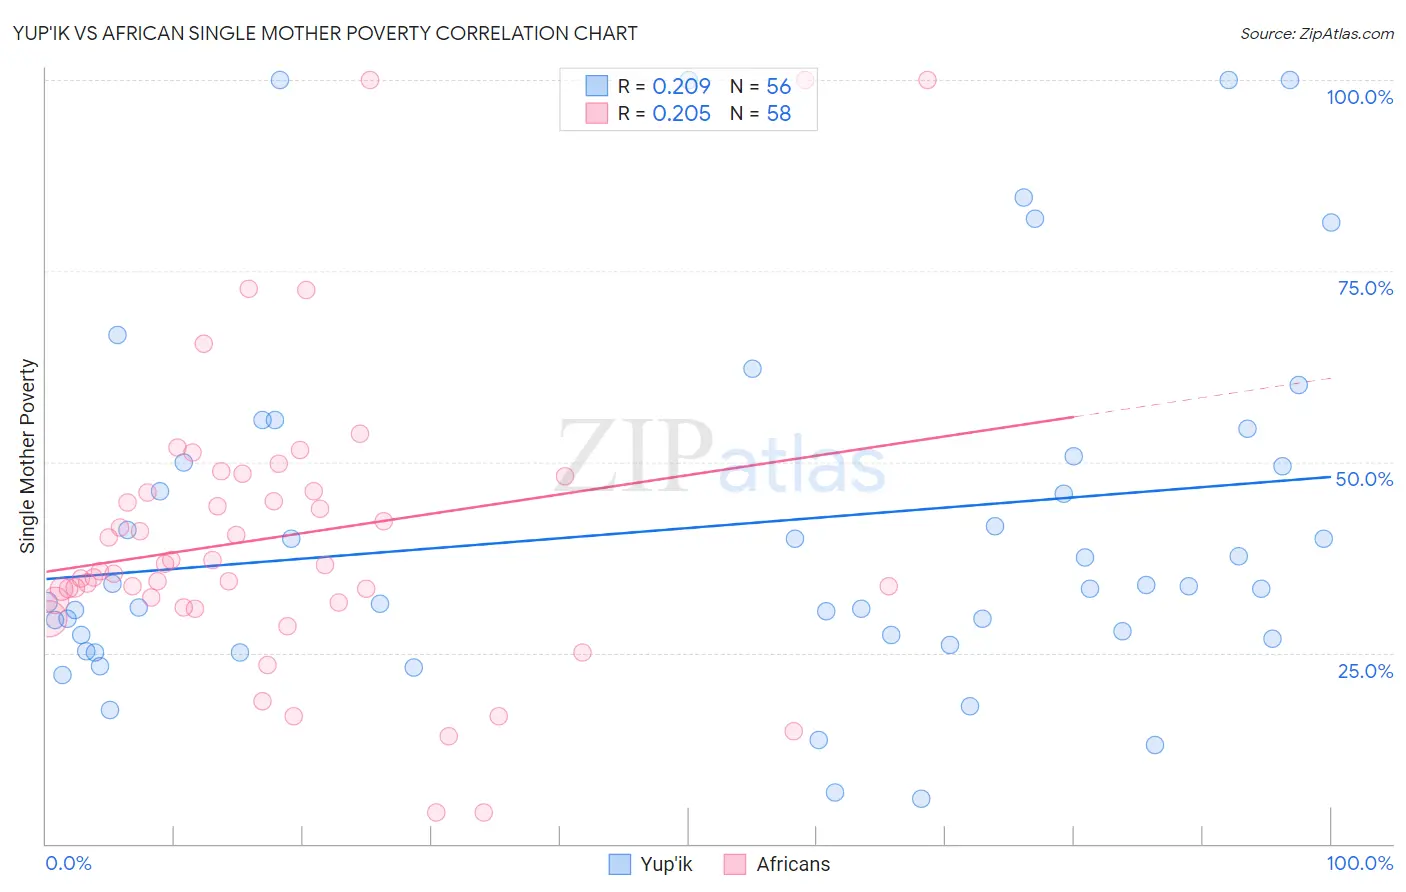
Yup'ik vs African Single Mother Poverty Correlation Chart
The statistical analysis conducted on geographies consisting of 39,732,342 people shows a weak positive correlation between the proportion of Yup'ik and poverty level among single mothers in the United States with a correlation coefficient (R) of 0.209 and weighted average of 32.5%. Similarly, the statistical analysis conducted on geographies consisting of 460,032,526 people shows a weak positive correlation between the proportion of Africans and poverty level among single mothers in the United States with a correlation coefficient (R) of 0.205 and weighted average of 33.3%, a difference of 2.5%.
Single Mother Poverty Correlation Summary
| Measurement | Yup'ik | African |
| Minimum | 5.9% | 4.1% |
| Maximum | 100.0% | 100.0% |
| Range | 94.1% | 95.9% |
| Mean | 41.4% | 40.2% |
| Median | 33.5% | 36.1% |
| Interquartile 25% (IQ1) | 27.1% | 31.9% |
| Interquartile 75% (IQ3) | 50.3% | 46.1% |
| Interquartile Range (IQR) | 23.3% | 14.2% |
| Standard Deviation (Sample) | 23.6% | 19.5% |
| Standard Deviation (Population) | 23.4% | 19.3% |
Demographics Similar to Yup'ik and Africans by Single Mother Poverty
In terms of single mother poverty, the demographic groups most similar to Yup'ik are Immigrants from Latin America (32.4%, a difference of 0.070%), Immigrants from Dominica (32.5%, a difference of 0.13%), Indonesian (32.4%, a difference of 0.19%), Somali (32.6%, a difference of 0.35%), and U.S. Virgin Islander (32.6%, a difference of 0.38%). Similarly, the demographic groups most similar to Africans are Immigrants from Guatemala (33.3%, a difference of 0.090%), Hispanic or Latino (33.3%, a difference of 0.090%), Pennsylvania German (33.2%, a difference of 0.11%), Blackfeet (33.2%, a difference of 0.25%), and Immigrants from Somalia (33.4%, a difference of 0.33%).
| Demographics | Rating | Rank | Single Mother Poverty |
| Immigrants | Azores | 0.0 /100 | #282 | Tragic 32.2% |
| Spanish Americans | 0.0 /100 | #283 | Tragic 32.3% |
| Indonesians | 0.0 /100 | #284 | Tragic 32.4% |
| Immigrants | Latin America | 0.0 /100 | #285 | Tragic 32.4% |
| Yup'ik | 0.0 /100 | #286 | Tragic 32.5% |
| Immigrants | Dominica | 0.0 /100 | #287 | Tragic 32.5% |
| Somalis | 0.0 /100 | #288 | Tragic 32.6% |
| U.S. Virgin Islanders | 0.0 /100 | #289 | Tragic 32.6% |
| Osage | 0.0 /100 | #290 | Tragic 32.6% |
| Guatemalans | 0.0 /100 | #291 | Tragic 32.9% |
| Shoshone | 0.0 /100 | #292 | Tragic 32.9% |
| Aleuts | 0.0 /100 | #293 | Tragic 32.9% |
| French American Indians | 0.0 /100 | #294 | Tragic 33.1% |
| Yaqui | 0.0 /100 | #295 | Tragic 33.1% |
| Blackfeet | 0.0 /100 | #296 | Tragic 33.2% |
| Pennsylvania Germans | 0.0 /100 | #297 | Tragic 33.2% |
| Africans | 0.0 /100 | #298 | Tragic 33.3% |
| Immigrants | Guatemala | 0.0 /100 | #299 | Tragic 33.3% |
| Hispanics or Latinos | 0.0 /100 | #300 | Tragic 33.3% |
| Immigrants | Somalia | 0.0 /100 | #301 | Tragic 33.4% |
| Arapaho | 0.0 /100 | #302 | Tragic 33.4% |