Tsimshian vs African Single Mother Poverty
COMPARE
Tsimshian
African
Single Mother Poverty
Single Mother Poverty Comparison
Tsimshian
Africans
26.8%
SINGLE MOTHER POVERTY
99.9/ 100
METRIC RATING
43rd/ 347
METRIC RANK
33.3%
SINGLE MOTHER POVERTY
0.0/ 100
METRIC RATING
298th/ 347
METRIC RANK
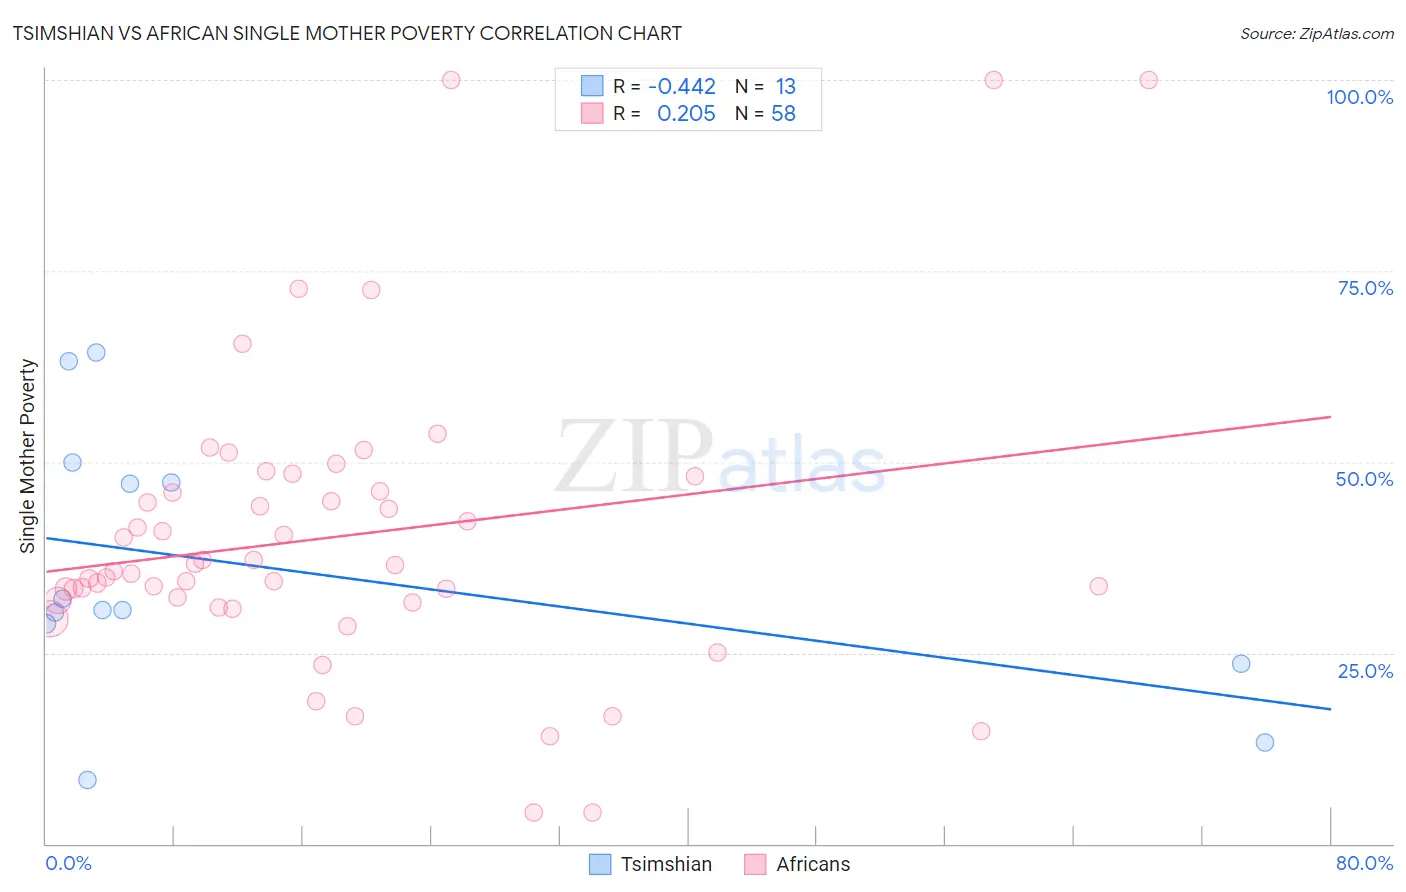
Tsimshian vs African Single Mother Poverty Correlation Chart
The statistical analysis conducted on geographies consisting of 15,606,004 people shows a moderate negative correlation between the proportion of Tsimshian and poverty level among single mothers in the United States with a correlation coefficient (R) of -0.442 and weighted average of 26.8%. Similarly, the statistical analysis conducted on geographies consisting of 460,032,526 people shows a weak positive correlation between the proportion of Africans and poverty level among single mothers in the United States with a correlation coefficient (R) of 0.205 and weighted average of 33.3%, a difference of 24.0%.
Single Mother Poverty Correlation Summary
| Measurement | Tsimshian | African |
| Minimum | 8.3% | 4.1% |
| Maximum | 64.3% | 100.0% |
| Range | 56.0% | 95.9% |
| Mean | 36.1% | 40.2% |
| Median | 30.6% | 36.1% |
| Interquartile 25% (IQ1) | 26.2% | 31.9% |
| Interquartile 75% (IQ3) | 48.7% | 46.1% |
| Interquartile Range (IQR) | 22.5% | 14.2% |
| Standard Deviation (Sample) | 17.3% | 19.5% |
| Standard Deviation (Population) | 16.6% | 19.3% |
Similar Demographics by Single Mother Poverty
Demographics Similar to Tsimshian by Single Mother Poverty
In terms of single mother poverty, the demographic groups most similar to Tsimshian are Armenian (26.8%, a difference of 0.080%), Immigrants from Sierra Leone (26.9%, a difference of 0.14%), Latvian (26.9%, a difference of 0.21%), Immigrants from Serbia (26.9%, a difference of 0.26%), and Immigrants from Greece (26.7%, a difference of 0.31%).
| Demographics | Rating | Rank | Single Mother Poverty |
| Okinawans | 99.9 /100 | #36 | Exceptional 26.6% |
| Immigrants | Israel | 99.9 /100 | #37 | Exceptional 26.6% |
| Immigrants | Fiji | 99.9 /100 | #38 | Exceptional 26.6% |
| Sri Lankans | 99.9 /100 | #39 | Exceptional 26.7% |
| Immigrants | Vietnam | 99.9 /100 | #40 | Exceptional 26.7% |
| Immigrants | Greece | 99.9 /100 | #41 | Exceptional 26.7% |
| Armenians | 99.9 /100 | #42 | Exceptional 26.8% |
| Tsimshian | 99.9 /100 | #43 | Exceptional 26.8% |
| Immigrants | Sierra Leone | 99.9 /100 | #44 | Exceptional 26.9% |
| Latvians | 99.9 /100 | #45 | Exceptional 26.9% |
| Immigrants | Serbia | 99.9 /100 | #46 | Exceptional 26.9% |
| Egyptians | 99.8 /100 | #47 | Exceptional 26.9% |
| Immigrants | Poland | 99.8 /100 | #48 | Exceptional 26.9% |
| Cambodians | 99.8 /100 | #49 | Exceptional 27.0% |
| Laotians | 99.8 /100 | #50 | Exceptional 27.0% |
Demographics Similar to Africans by Single Mother Poverty
In terms of single mother poverty, the demographic groups most similar to Africans are Immigrants from Guatemala (33.3%, a difference of 0.090%), Hispanic or Latino (33.3%, a difference of 0.090%), Pennsylvania German (33.2%, a difference of 0.11%), Blackfeet (33.2%, a difference of 0.25%), and Immigrants from Somalia (33.4%, a difference of 0.33%).
| Demographics | Rating | Rank | Single Mother Poverty |
| Guatemalans | 0.0 /100 | #291 | Tragic 32.9% |
| Shoshone | 0.0 /100 | #292 | Tragic 32.9% |
| Aleuts | 0.0 /100 | #293 | Tragic 32.9% |
| French American Indians | 0.0 /100 | #294 | Tragic 33.1% |
| Yaqui | 0.0 /100 | #295 | Tragic 33.1% |
| Blackfeet | 0.0 /100 | #296 | Tragic 33.2% |
| Pennsylvania Germans | 0.0 /100 | #297 | Tragic 33.2% |
| Africans | 0.0 /100 | #298 | Tragic 33.3% |
| Immigrants | Guatemala | 0.0 /100 | #299 | Tragic 33.3% |
| Hispanics or Latinos | 0.0 /100 | #300 | Tragic 33.3% |
| Immigrants | Somalia | 0.0 /100 | #301 | Tragic 33.4% |
| Arapaho | 0.0 /100 | #302 | Tragic 33.4% |
| Americans | 0.0 /100 | #303 | Tragic 33.5% |
| Mexicans | 0.0 /100 | #304 | Tragic 33.6% |
| Immigrants | Central America | 0.0 /100 | #305 | Tragic 33.6% |