Iranian vs African College, 1 year or more
COMPARE
Iranian
African
College, 1 year or more
College, 1 year or more Comparison
Iranians
Africans
70.0%
COLLEGE, 1 YEAR OR MORE
100.0/ 100
METRIC RATING
3rd/ 347
METRIC RANK
55.0%
COLLEGE, 1 YEAR OR MORE
0.4/ 100
METRIC RATING
258th/ 347
METRIC RANK
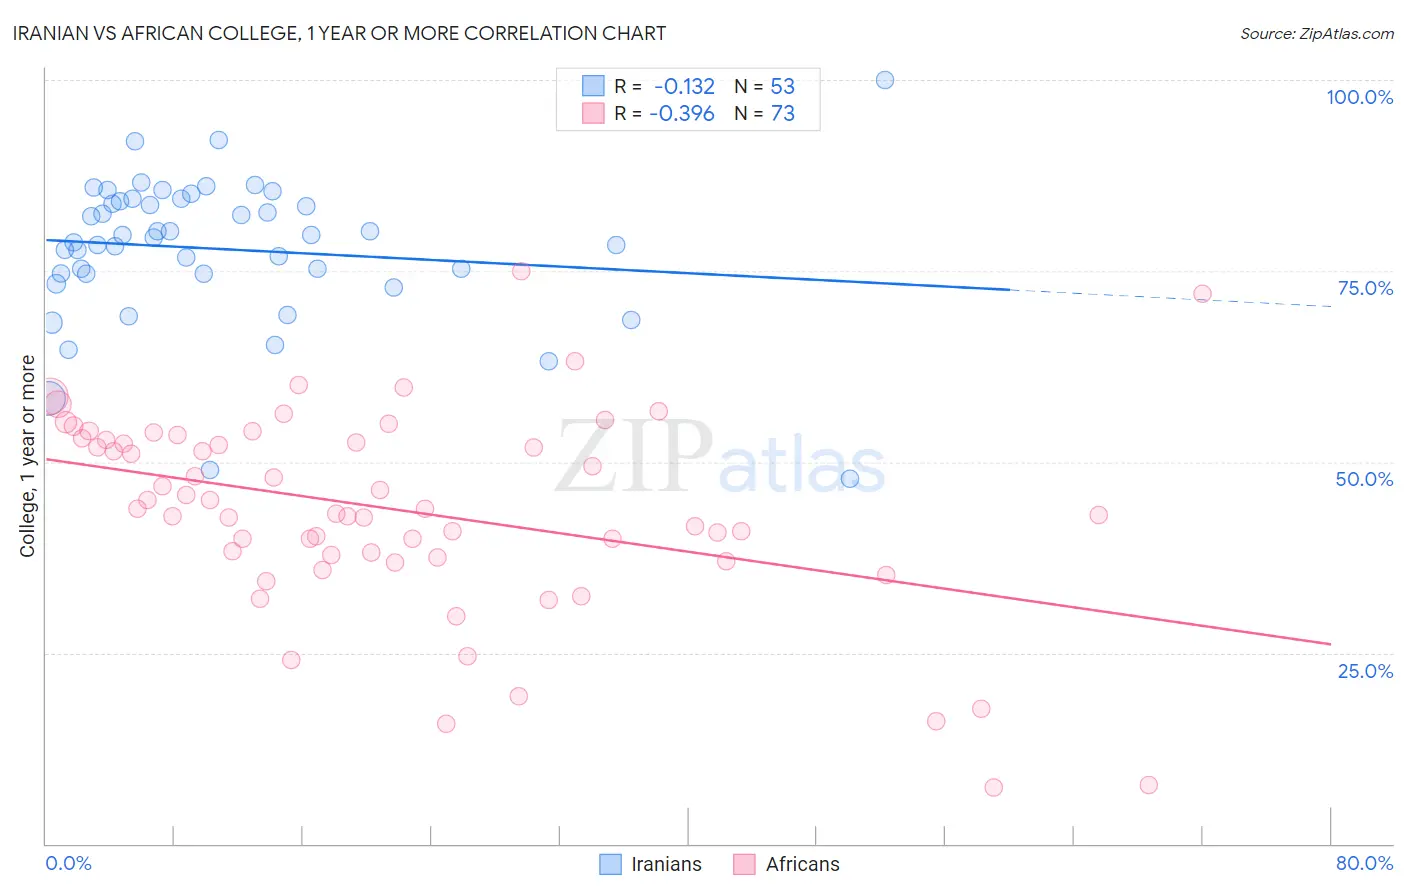
Iranian vs African College, 1 year or more Correlation Chart
The statistical analysis conducted on geographies consisting of 316,900,663 people shows a poor negative correlation between the proportion of Iranians and percentage of population with at least college, 1 year or more education in the United States with a correlation coefficient (R) of -0.132 and weighted average of 70.0%. Similarly, the statistical analysis conducted on geographies consisting of 470,090,594 people shows a mild negative correlation between the proportion of Africans and percentage of population with at least college, 1 year or more education in the United States with a correlation coefficient (R) of -0.396 and weighted average of 55.0%, a difference of 27.3%.
College, 1 year or more Correlation Summary
| Measurement | Iranian | African |
| Minimum | 47.7% | 7.4% |
| Maximum | 100.0% | 75.0% |
| Range | 52.3% | 67.6% |
| Mean | 77.8% | 43.7% |
| Median | 79.4% | 43.8% |
| Interquartile 25% (IQ1) | 74.6% | 37.7% |
| Interquartile 75% (IQ3) | 84.2% | 53.0% |
| Interquartile Range (IQR) | 9.7% | 15.3% |
| Standard Deviation (Sample) | 9.6% | 13.2% |
| Standard Deviation (Population) | 9.6% | 13.1% |
Similar Demographics by College, 1 year or more
Demographics Similar to Iranians by College, 1 year or more
In terms of college, 1 year or more, the demographic groups most similar to Iranians are Immigrants from Singapore (70.1%, a difference of 0.22%), Immigrants from Taiwan (69.6%, a difference of 0.49%), Immigrants from India (69.6%, a difference of 0.49%), Immigrants from Iran (69.5%, a difference of 0.70%), and Filipino (71.0%, a difference of 1.4%).
| Demographics | Rating | Rank | College, 1 year or more |
| Filipinos | 100.0 /100 | #1 | Exceptional 71.0% |
| Immigrants | Singapore | 100.0 /100 | #2 | Exceptional 70.1% |
| Iranians | 100.0 /100 | #3 | Exceptional 70.0% |
| Immigrants | Taiwan | 100.0 /100 | #4 | Exceptional 69.6% |
| Immigrants | India | 100.0 /100 | #5 | Exceptional 69.6% |
| Immigrants | Iran | 100.0 /100 | #6 | Exceptional 69.5% |
| Okinawans | 100.0 /100 | #7 | Exceptional 69.0% |
| Thais | 100.0 /100 | #8 | Exceptional 68.6% |
| Immigrants | Israel | 100.0 /100 | #9 | Exceptional 67.8% |
| Immigrants | Australia | 100.0 /100 | #10 | Exceptional 67.7% |
| Immigrants | South Central Asia | 100.0 /100 | #11 | Exceptional 67.1% |
| Cypriots | 100.0 /100 | #12 | Exceptional 67.0% |
| Immigrants | Sweden | 100.0 /100 | #13 | Exceptional 66.8% |
| Burmese | 100.0 /100 | #14 | Exceptional 66.7% |
| Cambodians | 100.0 /100 | #15 | Exceptional 66.7% |
Demographics Similar to Africans by College, 1 year or more
In terms of college, 1 year or more, the demographic groups most similar to Africans are Nepalese (54.9%, a difference of 0.060%), Jamaican (54.9%, a difference of 0.16%), Ottawa (54.9%, a difference of 0.19%), Immigrants from St. Vincent and the Grenadines (54.8%, a difference of 0.27%), and Indonesian (55.1%, a difference of 0.28%).
| Demographics | Rating | Rank | College, 1 year or more |
| Immigrants | Cambodia | 0.6 /100 | #251 | Tragic 55.4% |
| Aleuts | 0.6 /100 | #252 | Tragic 55.4% |
| Immigrants | Barbados | 0.6 /100 | #253 | Tragic 55.4% |
| Japanese | 0.5 /100 | #254 | Tragic 55.2% |
| Immigrants | Bahamas | 0.5 /100 | #255 | Tragic 55.2% |
| Immigrants | West Indies | 0.5 /100 | #256 | Tragic 55.2% |
| Indonesians | 0.4 /100 | #257 | Tragic 55.1% |
| Africans | 0.4 /100 | #258 | Tragic 55.0% |
| Nepalese | 0.3 /100 | #259 | Tragic 54.9% |
| Jamaicans | 0.3 /100 | #260 | Tragic 54.9% |
| Ottawa | 0.3 /100 | #261 | Tragic 54.9% |
| Immigrants | St. Vincent and the Grenadines | 0.3 /100 | #262 | Tragic 54.8% |
| U.S. Virgin Islanders | 0.3 /100 | #263 | Tragic 54.8% |
| Immigrants | Micronesia | 0.3 /100 | #264 | Tragic 54.8% |
| Immigrants | Laos | 0.2 /100 | #265 | Tragic 54.7% |