Apache vs African Single Mother Poverty
COMPARE
Apache
African
Single Mother Poverty
Single Mother Poverty Comparison
Apache
Africans
36.6%
SINGLE MOTHER POVERTY
0.0/ 100
METRIC RATING
329th/ 347
METRIC RANK
33.3%
SINGLE MOTHER POVERTY
0.0/ 100
METRIC RATING
298th/ 347
METRIC RANK
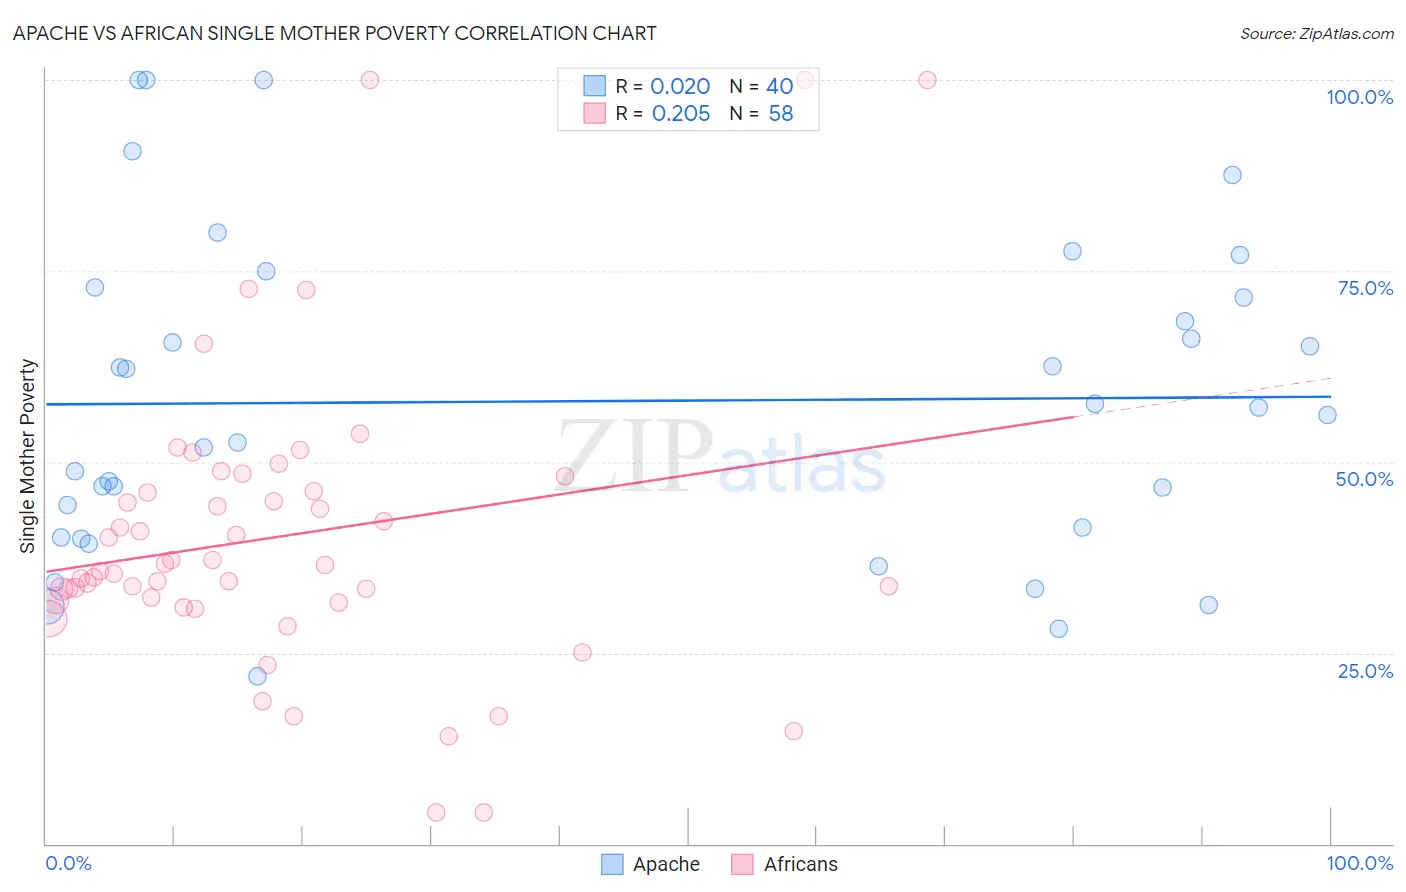
Apache vs African Single Mother Poverty Correlation Chart
The statistical analysis conducted on geographies consisting of 229,112,849 people shows no correlation between the proportion of Apache and poverty level among single mothers in the United States with a correlation coefficient (R) of 0.020 and weighted average of 36.6%. Similarly, the statistical analysis conducted on geographies consisting of 460,032,526 people shows a weak positive correlation between the proportion of Africans and poverty level among single mothers in the United States with a correlation coefficient (R) of 0.205 and weighted average of 33.3%, a difference of 10.0%.
Single Mother Poverty Correlation Summary
| Measurement | Apache | African |
| Minimum | 21.9% | 4.1% |
| Maximum | 100.0% | 100.0% |
| Range | 78.1% | 95.9% |
| Mean | 57.9% | 40.2% |
| Median | 56.6% | 36.1% |
| Interquartile 25% (IQ1) | 40.8% | 31.9% |
| Interquartile 75% (IQ3) | 72.2% | 46.1% |
| Interquartile Range (IQR) | 31.4% | 14.2% |
| Standard Deviation (Sample) | 20.8% | 19.5% |
| Standard Deviation (Population) | 20.5% | 19.3% |
Similar Demographics by Single Mother Poverty
Demographics Similar to Apache by Single Mother Poverty
In terms of single mother poverty, the demographic groups most similar to Apache are Native/Alaskan (36.6%, a difference of 0.10%), Creek (36.7%, a difference of 0.26%), Choctaw (36.4%, a difference of 0.48%), Dutch West Indian (36.8%, a difference of 0.50%), and Yakama (36.4%, a difference of 0.53%).
| Demographics | Rating | Rank | Single Mother Poverty |
| Blacks/African Americans | 0.0 /100 | #322 | Tragic 35.2% |
| Kiowa | 0.0 /100 | #323 | Tragic 35.5% |
| Ottawa | 0.0 /100 | #324 | Tragic 35.5% |
| Ute | 0.0 /100 | #325 | Tragic 35.7% |
| Seminole | 0.0 /100 | #326 | Tragic 35.8% |
| Yakama | 0.0 /100 | #327 | Tragic 36.4% |
| Choctaw | 0.0 /100 | #328 | Tragic 36.4% |
| Apache | 0.0 /100 | #329 | Tragic 36.6% |
| Natives/Alaskans | 0.0 /100 | #330 | Tragic 36.6% |
| Creek | 0.0 /100 | #331 | Tragic 36.7% |
| Dutch West Indians | 0.0 /100 | #332 | Tragic 36.8% |
| Menominee | 0.0 /100 | #333 | Tragic 37.1% |
| Pueblo | 0.0 /100 | #334 | Tragic 37.2% |
| Yuman | 0.0 /100 | #335 | Tragic 37.8% |
| Cheyenne | 0.0 /100 | #336 | Tragic 38.5% |
Demographics Similar to Africans by Single Mother Poverty
In terms of single mother poverty, the demographic groups most similar to Africans are Immigrants from Guatemala (33.3%, a difference of 0.090%), Hispanic or Latino (33.3%, a difference of 0.090%), Pennsylvania German (33.2%, a difference of 0.11%), Blackfeet (33.2%, a difference of 0.25%), and Immigrants from Somalia (33.4%, a difference of 0.33%).
| Demographics | Rating | Rank | Single Mother Poverty |
| Guatemalans | 0.0 /100 | #291 | Tragic 32.9% |
| Shoshone | 0.0 /100 | #292 | Tragic 32.9% |
| Aleuts | 0.0 /100 | #293 | Tragic 32.9% |
| French American Indians | 0.0 /100 | #294 | Tragic 33.1% |
| Yaqui | 0.0 /100 | #295 | Tragic 33.1% |
| Blackfeet | 0.0 /100 | #296 | Tragic 33.2% |
| Pennsylvania Germans | 0.0 /100 | #297 | Tragic 33.2% |
| Africans | 0.0 /100 | #298 | Tragic 33.3% |
| Immigrants | Guatemala | 0.0 /100 | #299 | Tragic 33.3% |
| Hispanics or Latinos | 0.0 /100 | #300 | Tragic 33.3% |
| Immigrants | Somalia | 0.0 /100 | #301 | Tragic 33.4% |
| Arapaho | 0.0 /100 | #302 | Tragic 33.4% |
| Americans | 0.0 /100 | #303 | Tragic 33.5% |
| Mexicans | 0.0 /100 | #304 | Tragic 33.6% |
| Immigrants | Central America | 0.0 /100 | #305 | Tragic 33.6% |