Inupiat vs Immigrants from Singapore 2 or more Vehicles in Household
COMPARE
Inupiat
Immigrants from Singapore
2 or more Vehicles in Household
2 or more Vehicles in Household Comparison
Inupiat
Immigrants from Singapore
42.6%
2 OR MORE VEHICLES IN HOUSEHOLD
0.0/ 100
METRIC RATING
328th/ 347
METRIC RANK
53.9%
2 OR MORE VEHICLES IN HOUSEHOLD
6.3/ 100
METRIC RATING
221st/ 347
METRIC RANK
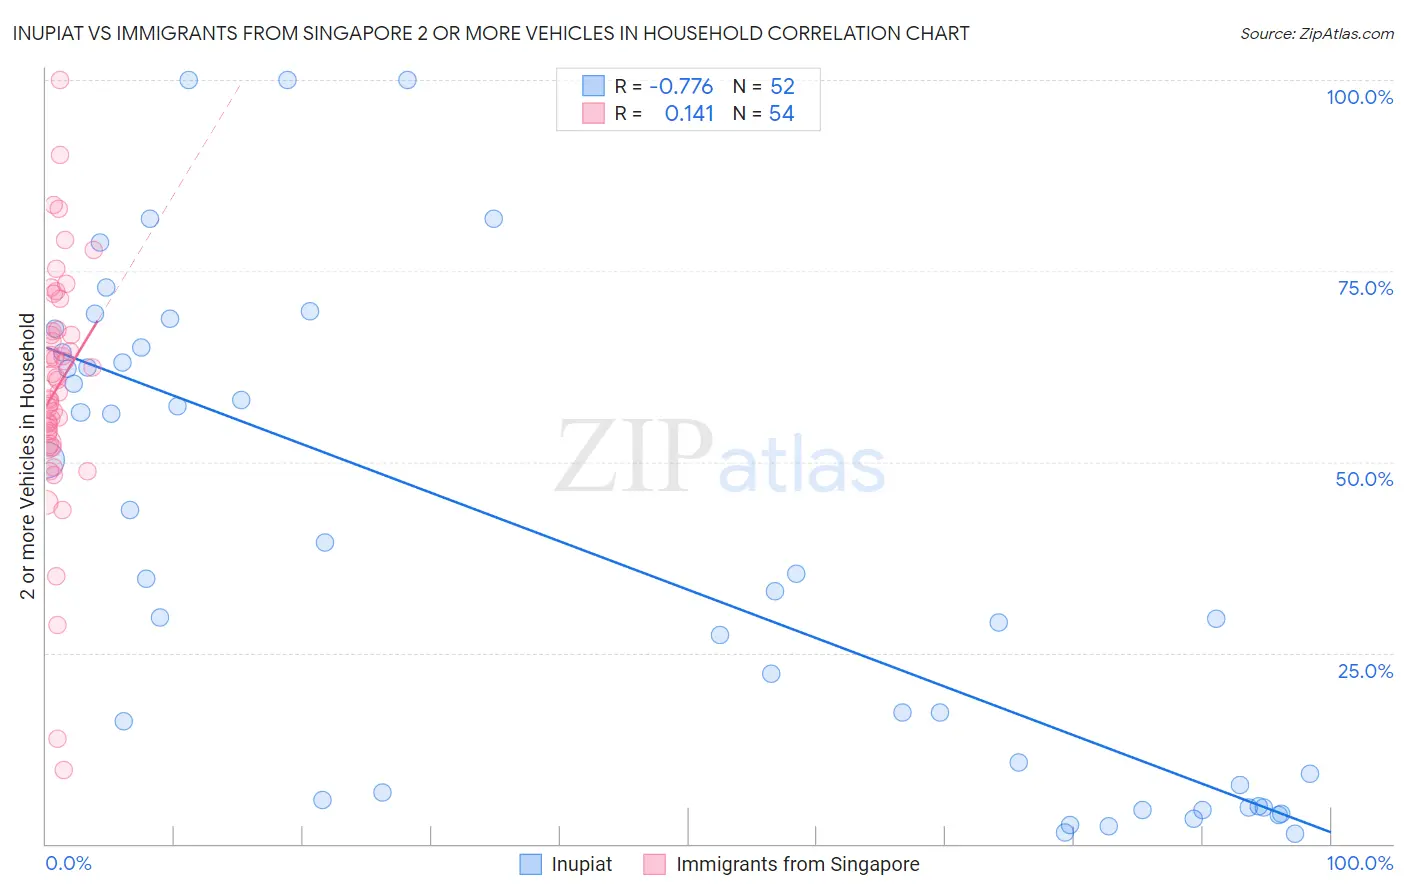
Inupiat vs Immigrants from Singapore 2 or more Vehicles in Household Correlation Chart
The statistical analysis conducted on geographies consisting of 96,302,889 people shows a strong negative correlation between the proportion of Inupiat and percentage of households with 2 or more vehicles available in the United States with a correlation coefficient (R) of -0.776 and weighted average of 42.6%. Similarly, the statistical analysis conducted on geographies consisting of 137,464,640 people shows a poor positive correlation between the proportion of Immigrants from Singapore and percentage of households with 2 or more vehicles available in the United States with a correlation coefficient (R) of 0.141 and weighted average of 53.9%, a difference of 26.3%.
2 or more Vehicles in Household Correlation Summary
| Measurement | Inupiat | Immigrants from Singapore |
| Minimum | 1.4% | 9.7% |
| Maximum | 100.0% | 100.0% |
| Range | 98.6% | 90.3% |
| Mean | 38.5% | 59.7% |
| Median | 33.9% | 59.9% |
| Interquartile 25% (IQ1) | 6.2% | 52.4% |
| Interquartile 75% (IQ3) | 63.7% | 67.1% |
| Interquartile Range (IQR) | 57.5% | 14.6% |
| Standard Deviation (Sample) | 30.7% | 15.9% |
| Standard Deviation (Population) | 30.4% | 15.7% |
Similar Demographics by 2 or more Vehicles in Household
Demographics Similar to Inupiat by 2 or more Vehicles in Household
In terms of 2 or more vehicles in household, the demographic groups most similar to Inupiat are Immigrants from Yemen (42.8%, a difference of 0.50%), Immigrants from Senegal (43.0%, a difference of 0.91%), Immigrants from West Indies (43.1%, a difference of 1.1%), Ecuadorian (42.0%, a difference of 1.6%), and Immigrants from Cabo Verde (43.3%, a difference of 1.6%).
| Demographics | Rating | Rank | 2 or more Vehicles in Household |
| Immigrants | Jamaica | 0.0 /100 | #321 | Tragic 44.5% |
| Senegalese | 0.0 /100 | #322 | Tragic 44.2% |
| Immigrants | Caribbean | 0.0 /100 | #323 | Tragic 44.2% |
| Immigrants | Cabo Verde | 0.0 /100 | #324 | Tragic 43.3% |
| Immigrants | West Indies | 0.0 /100 | #325 | Tragic 43.1% |
| Immigrants | Senegal | 0.0 /100 | #326 | Tragic 43.0% |
| Immigrants | Yemen | 0.0 /100 | #327 | Tragic 42.8% |
| Inupiat | 0.0 /100 | #328 | Tragic 42.6% |
| Ecuadorians | 0.0 /100 | #329 | Tragic 42.0% |
| Immigrants | Dominica | 0.0 /100 | #330 | Tragic 41.6% |
| West Indians | 0.0 /100 | #331 | Tragic 41.3% |
| Trinidadians and Tobagonians | 0.0 /100 | #332 | Tragic 40.9% |
| Immigrants | Ecuador | 0.0 /100 | #333 | Tragic 40.5% |
| Immigrants | Trinidad and Tobago | 0.0 /100 | #334 | Tragic 40.3% |
| Immigrants | Bangladesh | 0.0 /100 | #335 | Tragic 38.8% |
Demographics Similar to Immigrants from Singapore by 2 or more Vehicles in Household
In terms of 2 or more vehicles in household, the demographic groups most similar to Immigrants from Singapore are Taiwanese (53.9%, a difference of 0.010%), Kiowa (53.9%, a difference of 0.010%), South American Indian (53.9%, a difference of 0.040%), Immigrants from Argentina (53.9%, a difference of 0.10%), and Immigrants from Burma/Myanmar (53.9%, a difference of 0.14%).
| Demographics | Rating | Rank | 2 or more Vehicles in Household |
| Immigrants | Czechoslovakia | 9.4 /100 | #214 | Tragic 54.1% |
| Aleuts | 9.3 /100 | #215 | Tragic 54.1% |
| Immigrants | Western Asia | 9.3 /100 | #216 | Tragic 54.1% |
| Immigrants | Burma/Myanmar | 7.1 /100 | #217 | Tragic 53.9% |
| Immigrants | Argentina | 6.8 /100 | #218 | Tragic 53.9% |
| South American Indians | 6.5 /100 | #219 | Tragic 53.9% |
| Taiwanese | 6.3 /100 | #220 | Tragic 53.9% |
| Immigrants | Singapore | 6.3 /100 | #221 | Tragic 53.9% |
| Kiowa | 6.2 /100 | #222 | Tragic 53.9% |
| Immigrants | Bosnia and Herzegovina | 5.5 /100 | #223 | Tragic 53.8% |
| Brazilians | 5.3 /100 | #224 | Tragic 53.8% |
| Immigrants | Egypt | 5.2 /100 | #225 | Tragic 53.8% |
| Immigrants | Eastern Africa | 5.1 /100 | #226 | Tragic 53.7% |
| Sudanese | 4.1 /100 | #227 | Tragic 53.6% |
| Alaska Natives | 3.9 /100 | #228 | Tragic 53.6% |