Inupiat vs Apache Female Poverty
COMPARE
Inupiat
Apache
Female Poverty
Female Poverty Comparison
Inupiat
Apache
16.2%
FEMALE POVERTY
0.0/ 100
METRIC RATING
286th/ 347
METRIC RANK
19.2%
FEMALE POVERTY
0.0/ 100
METRIC RATING
332nd/ 347
METRIC RANK
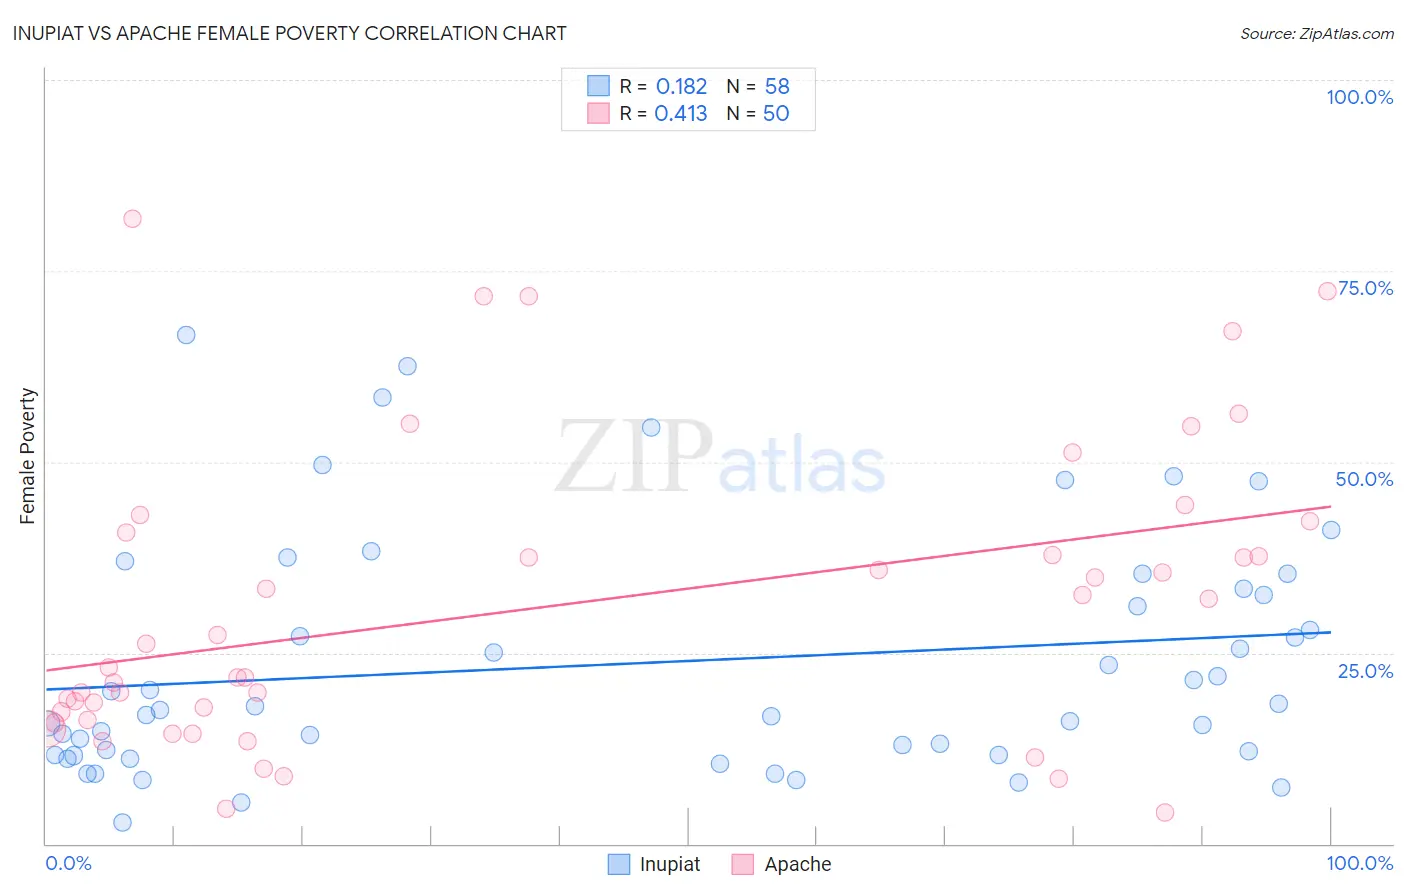
Inupiat vs Apache Female Poverty Correlation Chart
The statistical analysis conducted on geographies consisting of 96,314,579 people shows a poor positive correlation between the proportion of Inupiat and poverty level among females in the United States with a correlation coefficient (R) of 0.182 and weighted average of 16.2%. Similarly, the statistical analysis conducted on geographies consisting of 230,999,825 people shows a moderate positive correlation between the proportion of Apache and poverty level among females in the United States with a correlation coefficient (R) of 0.413 and weighted average of 19.2%, a difference of 18.4%.
Female Poverty Correlation Summary
| Measurement | Inupiat | Apache |
| Minimum | 2.8% | 4.1% |
| Maximum | 66.7% | 81.8% |
| Range | 63.9% | 77.7% |
| Mean | 23.7% | 31.0% |
| Median | 17.7% | 24.6% |
| Interquartile 25% (IQ1) | 11.6% | 16.2% |
| Interquartile 75% (IQ3) | 33.3% | 40.7% |
| Interquartile Range (IQR) | 21.7% | 24.5% |
| Standard Deviation (Sample) | 15.6% | 19.5% |
| Standard Deviation (Population) | 15.5% | 19.3% |
Similar Demographics by Female Poverty
Demographics Similar to Inupiat by Female Poverty
In terms of female poverty, the demographic groups most similar to Inupiat are Immigrants from Belize (16.3%, a difference of 0.19%), Comanche (16.2%, a difference of 0.44%), Spanish American (16.2%, a difference of 0.52%), Immigrants from Cuba (16.1%, a difference of 0.57%), and Immigrants from Haiti (16.1%, a difference of 0.65%).
| Demographics | Rating | Rank | Female Poverty |
| Immigrants | Bahamas | 0.0 /100 | #279 | Tragic 16.1% |
| Vietnamese | 0.0 /100 | #280 | Tragic 16.1% |
| West Indians | 0.0 /100 | #281 | Tragic 16.1% |
| Immigrants | Haiti | 0.0 /100 | #282 | Tragic 16.1% |
| Immigrants | Cuba | 0.0 /100 | #283 | Tragic 16.1% |
| Spanish Americans | 0.0 /100 | #284 | Tragic 16.2% |
| Comanche | 0.0 /100 | #285 | Tragic 16.2% |
| Inupiat | 0.0 /100 | #286 | Tragic 16.2% |
| Immigrants | Belize | 0.0 /100 | #287 | Tragic 16.3% |
| Indonesians | 0.0 /100 | #288 | Tragic 16.4% |
| Blackfeet | 0.0 /100 | #289 | Tragic 16.4% |
| Immigrants | Bangladesh | 0.0 /100 | #290 | Tragic 16.4% |
| Yaqui | 0.0 /100 | #291 | Tragic 16.4% |
| Immigrants | Zaire | 0.0 /100 | #292 | Tragic 16.4% |
| Immigrants | Latin America | 0.0 /100 | #293 | Tragic 16.4% |
Demographics Similar to Apache by Female Poverty
In terms of female poverty, the demographic groups most similar to Apache are Native/Alaskan (19.2%, a difference of 0.16%), Dominican (19.1%, a difference of 0.58%), Immigrants from Dominican Republic (19.3%, a difference of 0.60%), Kiowa (18.6%, a difference of 3.3%), and Black/African American (18.6%, a difference of 3.5%).
| Demographics | Rating | Rank | Female Poverty |
| Colville | 0.0 /100 | #325 | Tragic 17.8% |
| Central American Indians | 0.0 /100 | #326 | Tragic 18.0% |
| Yakama | 0.0 /100 | #327 | Tragic 18.0% |
| Blacks/African Americans | 0.0 /100 | #328 | Tragic 18.6% |
| Kiowa | 0.0 /100 | #329 | Tragic 18.6% |
| Dominicans | 0.0 /100 | #330 | Tragic 19.1% |
| Natives/Alaskans | 0.0 /100 | #331 | Tragic 19.2% |
| Apache | 0.0 /100 | #332 | Tragic 19.2% |
| Immigrants | Dominican Republic | 0.0 /100 | #333 | Tragic 19.3% |
| Houma | 0.0 /100 | #334 | Tragic 20.0% |
| Cheyenne | 0.0 /100 | #335 | Tragic 20.2% |
| Pueblo | 0.0 /100 | #336 | Tragic 20.7% |
| Yuman | 0.0 /100 | #337 | Tragic 20.8% |
| Sioux | 0.0 /100 | #338 | Tragic 20.9% |
| Hopi | 0.0 /100 | #339 | Tragic 21.0% |