Inupiat vs Iroquois Female Poverty
COMPARE
Inupiat
Iroquois
Female Poverty
Female Poverty Comparison
Inupiat
Iroquois
16.2%
FEMALE POVERTY
0.0/ 100
METRIC RATING
286th/ 347
METRIC RANK
15.8%
FEMALE POVERTY
0.1/ 100
METRIC RATING
269th/ 347
METRIC RANK
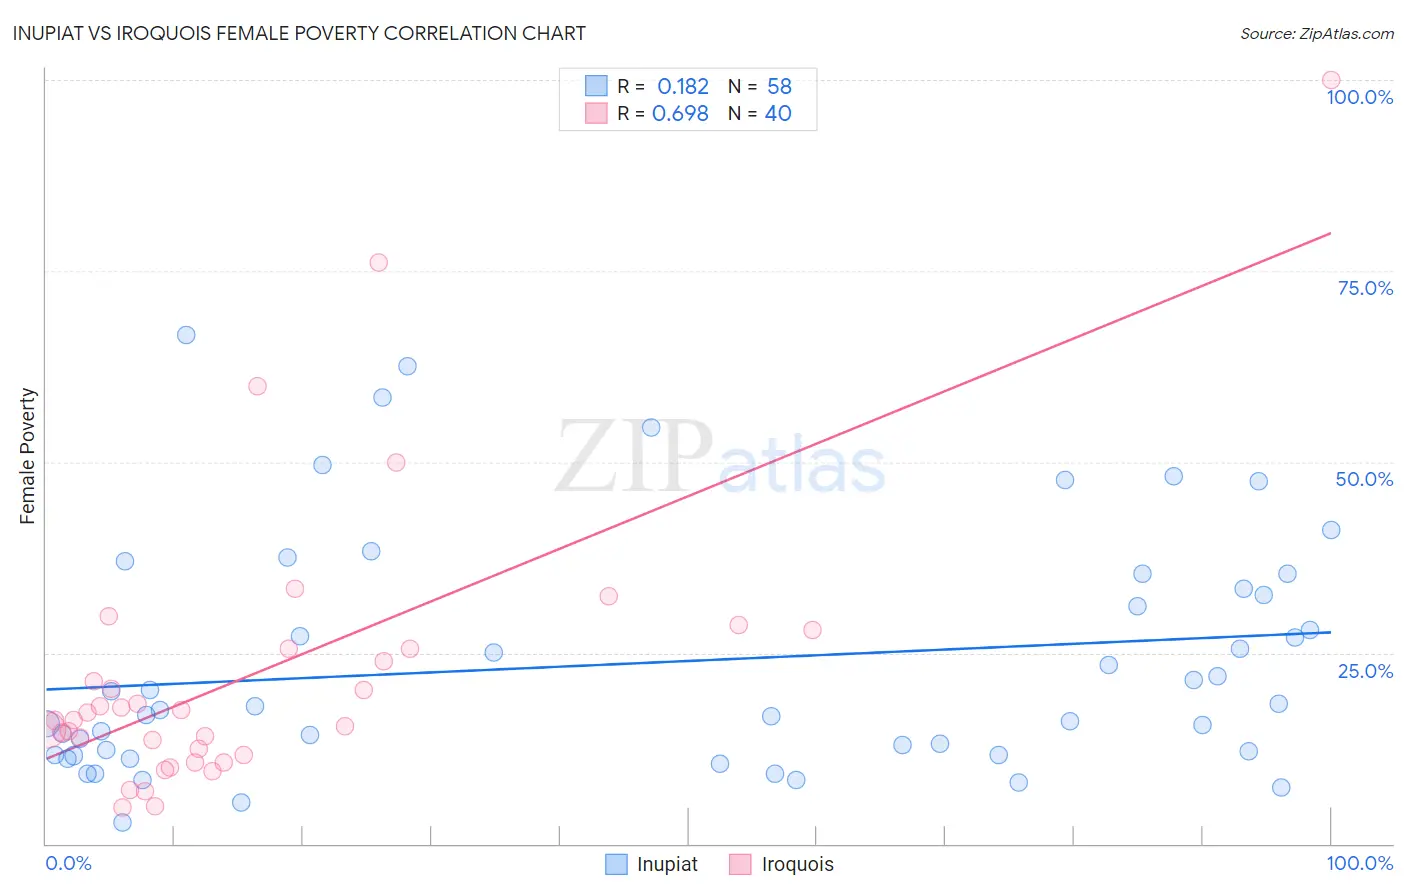
Inupiat vs Iroquois Female Poverty Correlation Chart
The statistical analysis conducted on geographies consisting of 96,314,579 people shows a poor positive correlation between the proportion of Inupiat and poverty level among females in the United States with a correlation coefficient (R) of 0.182 and weighted average of 16.2%. Similarly, the statistical analysis conducted on geographies consisting of 207,228,109 people shows a significant positive correlation between the proportion of Iroquois and poverty level among females in the United States with a correlation coefficient (R) of 0.698 and weighted average of 15.8%, a difference of 2.7%.
Female Poverty Correlation Summary
| Measurement | Inupiat | Iroquois |
| Minimum | 2.8% | 4.7% |
| Maximum | 66.7% | 100.0% |
| Range | 63.9% | 95.3% |
| Mean | 23.7% | 22.4% |
| Median | 17.7% | 16.7% |
| Interquartile 25% (IQ1) | 11.6% | 12.0% |
| Interquartile 75% (IQ3) | 33.3% | 25.5% |
| Interquartile Range (IQR) | 21.7% | 13.5% |
| Standard Deviation (Sample) | 15.6% | 19.0% |
| Standard Deviation (Population) | 15.5% | 18.8% |
Demographics Similar to Inupiat and Iroquois by Female Poverty
In terms of female poverty, the demographic groups most similar to Inupiat are Immigrants from Belize (16.3%, a difference of 0.19%), Comanche (16.2%, a difference of 0.44%), Spanish American (16.2%, a difference of 0.52%), Immigrants from Cuba (16.1%, a difference of 0.57%), and Immigrants from Haiti (16.1%, a difference of 0.65%). Similarly, the demographic groups most similar to Iroquois are Chickasaw (15.9%, a difference of 0.26%), Immigrants from Nicaragua (15.8%, a difference of 0.37%), Subsaharan African (15.8%, a difference of 0.43%), Immigrants from St. Vincent and the Grenadines (15.9%, a difference of 0.54%), and Belizean (15.9%, a difference of 0.76%).
| Demographics | Rating | Rank | Female Poverty |
| Sub-Saharan Africans | 0.1 /100 | #267 | Tragic 15.8% |
| Immigrants | Nicaragua | 0.1 /100 | #268 | Tragic 15.8% |
| Iroquois | 0.1 /100 | #269 | Tragic 15.8% |
| Chickasaw | 0.1 /100 | #270 | Tragic 15.9% |
| Immigrants | St. Vincent and the Grenadines | 0.0 /100 | #271 | Tragic 15.9% |
| Belizeans | 0.0 /100 | #272 | Tragic 15.9% |
| Haitians | 0.0 /100 | #273 | Tragic 15.9% |
| Barbadians | 0.0 /100 | #274 | Tragic 15.9% |
| Immigrants | Barbados | 0.0 /100 | #275 | Tragic 16.0% |
| Central Americans | 0.0 /100 | #276 | Tragic 16.0% |
| Bangladeshis | 0.0 /100 | #277 | Tragic 16.0% |
| Immigrants | West Indies | 0.0 /100 | #278 | Tragic 16.1% |
| Immigrants | Bahamas | 0.0 /100 | #279 | Tragic 16.1% |
| Vietnamese | 0.0 /100 | #280 | Tragic 16.1% |
| West Indians | 0.0 /100 | #281 | Tragic 16.1% |
| Immigrants | Haiti | 0.0 /100 | #282 | Tragic 16.1% |
| Immigrants | Cuba | 0.0 /100 | #283 | Tragic 16.1% |
| Spanish Americans | 0.0 /100 | #284 | Tragic 16.2% |
| Comanche | 0.0 /100 | #285 | Tragic 16.2% |
| Inupiat | 0.0 /100 | #286 | Tragic 16.2% |
| Immigrants | Belize | 0.0 /100 | #287 | Tragic 16.3% |