Immigrants from Iran vs Apache Female Poverty
COMPARE
Immigrants from Iran
Apache
Female Poverty
Female Poverty Comparison
Immigrants from Iran
Apache
11.8%
FEMALE POVERTY
99.4/ 100
METRIC RATING
35th/ 347
METRIC RANK
19.2%
FEMALE POVERTY
0.0/ 100
METRIC RATING
332nd/ 347
METRIC RANK
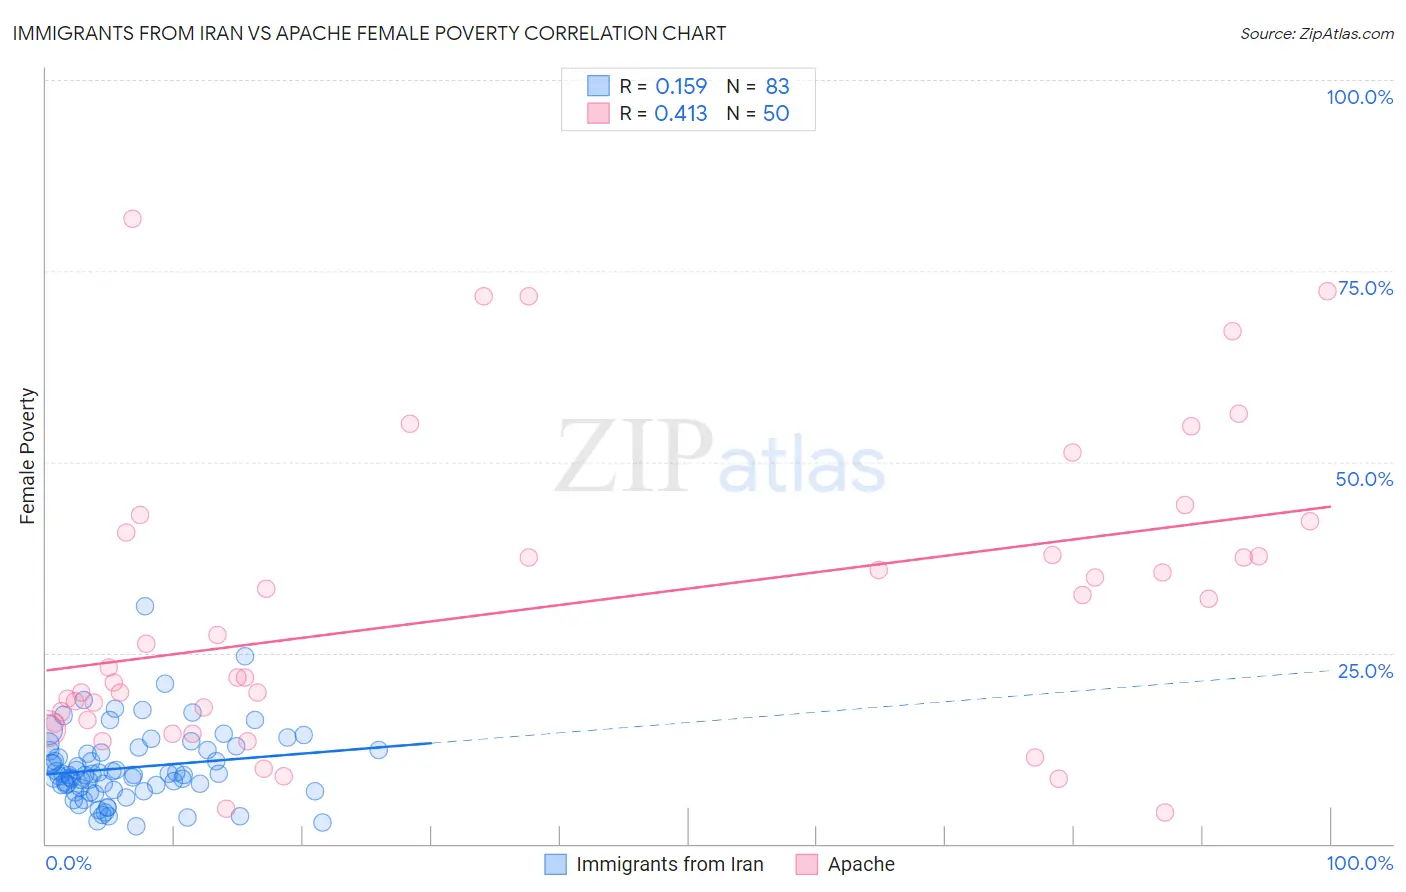
Immigrants from Iran vs Apache Female Poverty Correlation Chart
The statistical analysis conducted on geographies consisting of 279,829,066 people shows a poor positive correlation between the proportion of Immigrants from Iran and poverty level among females in the United States with a correlation coefficient (R) of 0.159 and weighted average of 11.8%. Similarly, the statistical analysis conducted on geographies consisting of 230,999,825 people shows a moderate positive correlation between the proportion of Apache and poverty level among females in the United States with a correlation coefficient (R) of 0.413 and weighted average of 19.2%, a difference of 63.1%.
Female Poverty Correlation Summary
| Measurement | Immigrants from Iran | Apache |
| Minimum | 2.3% | 4.1% |
| Maximum | 31.0% | 81.8% |
| Range | 28.7% | 77.7% |
| Mean | 10.0% | 31.0% |
| Median | 9.1% | 24.6% |
| Interquartile 25% (IQ1) | 7.0% | 16.2% |
| Interquartile 75% (IQ3) | 12.3% | 40.7% |
| Interquartile Range (IQR) | 5.2% | 24.5% |
| Standard Deviation (Sample) | 4.9% | 19.5% |
| Standard Deviation (Population) | 4.8% | 19.3% |
Similar Demographics by Female Poverty
Demographics Similar to Immigrants from Iran by Female Poverty
In terms of female poverty, the demographic groups most similar to Immigrants from Iran are Immigrants from Singapore (11.8%, a difference of 0.17%), Immigrants from Pakistan (11.8%, a difference of 0.17%), Immigrants from Greece (11.8%, a difference of 0.27%), Russian (11.8%, a difference of 0.28%), and Cypriot (11.8%, a difference of 0.29%).
| Demographics | Rating | Rank | Female Poverty |
| Immigrants | Korea | 99.6 /100 | #28 | Exceptional 11.7% |
| Immigrants | North Macedonia | 99.6 /100 | #29 | Exceptional 11.7% |
| Greeks | 99.5 /100 | #30 | Exceptional 11.7% |
| Poles | 99.5 /100 | #31 | Exceptional 11.7% |
| Danes | 99.5 /100 | #32 | Exceptional 11.7% |
| Cypriots | 99.5 /100 | #33 | Exceptional 11.8% |
| Immigrants | Singapore | 99.4 /100 | #34 | Exceptional 11.8% |
| Immigrants | Iran | 99.4 /100 | #35 | Exceptional 11.8% |
| Immigrants | Pakistan | 99.4 /100 | #36 | Exceptional 11.8% |
| Immigrants | Greece | 99.3 /100 | #37 | Exceptional 11.8% |
| Russians | 99.3 /100 | #38 | Exceptional 11.8% |
| Immigrants | Poland | 99.3 /100 | #39 | Exceptional 11.8% |
| Macedonians | 99.3 /100 | #40 | Exceptional 11.8% |
| Czechs | 99.2 /100 | #41 | Exceptional 11.9% |
| Immigrants | Moldova | 99.2 /100 | #42 | Exceptional 11.9% |
Demographics Similar to Apache by Female Poverty
In terms of female poverty, the demographic groups most similar to Apache are Native/Alaskan (19.2%, a difference of 0.16%), Dominican (19.1%, a difference of 0.58%), Immigrants from Dominican Republic (19.3%, a difference of 0.60%), Kiowa (18.6%, a difference of 3.3%), and Black/African American (18.6%, a difference of 3.5%).
| Demographics | Rating | Rank | Female Poverty |
| Colville | 0.0 /100 | #325 | Tragic 17.8% |
| Central American Indians | 0.0 /100 | #326 | Tragic 18.0% |
| Yakama | 0.0 /100 | #327 | Tragic 18.0% |
| Blacks/African Americans | 0.0 /100 | #328 | Tragic 18.6% |
| Kiowa | 0.0 /100 | #329 | Tragic 18.6% |
| Dominicans | 0.0 /100 | #330 | Tragic 19.1% |
| Natives/Alaskans | 0.0 /100 | #331 | Tragic 19.2% |
| Apache | 0.0 /100 | #332 | Tragic 19.2% |
| Immigrants | Dominican Republic | 0.0 /100 | #333 | Tragic 19.3% |
| Houma | 0.0 /100 | #334 | Tragic 20.0% |
| Cheyenne | 0.0 /100 | #335 | Tragic 20.2% |
| Pueblo | 0.0 /100 | #336 | Tragic 20.7% |
| Yuman | 0.0 /100 | #337 | Tragic 20.8% |
| Sioux | 0.0 /100 | #338 | Tragic 20.9% |
| Hopi | 0.0 /100 | #339 | Tragic 21.0% |