U.S. Virgin Islander vs Apache Female Poverty
COMPARE
U.S. Virgin Islander
Apache
Female Poverty
Female Poverty Comparison
U.S. Virgin Islanders
Apache
17.3%
FEMALE POVERTY
0.0/ 100
METRIC RATING
315th/ 347
METRIC RANK
19.2%
FEMALE POVERTY
0.0/ 100
METRIC RATING
332nd/ 347
METRIC RANK
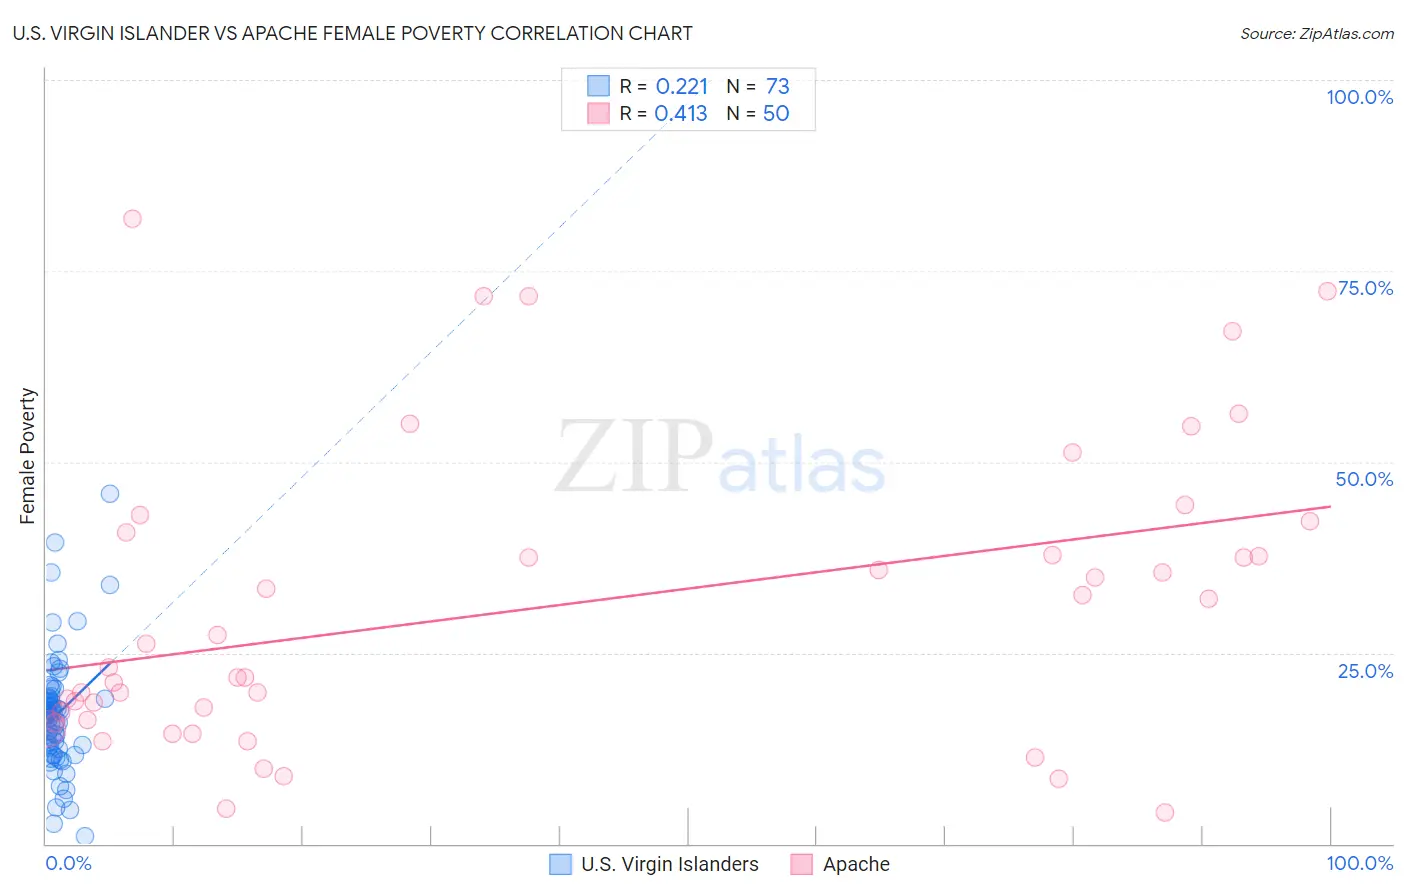
U.S. Virgin Islander vs Apache Female Poverty Correlation Chart
The statistical analysis conducted on geographies consisting of 87,511,950 people shows a weak positive correlation between the proportion of U.S. Virgin Islanders and poverty level among females in the United States with a correlation coefficient (R) of 0.221 and weighted average of 17.3%. Similarly, the statistical analysis conducted on geographies consisting of 230,999,825 people shows a moderate positive correlation between the proportion of Apache and poverty level among females in the United States with a correlation coefficient (R) of 0.413 and weighted average of 19.2%, a difference of 11.1%.
Female Poverty Correlation Summary
| Measurement | U.S. Virgin Islander | Apache |
| Minimum | 0.93% | 4.1% |
| Maximum | 45.9% | 81.8% |
| Range | 45.0% | 77.7% |
| Mean | 16.9% | 31.0% |
| Median | 16.8% | 24.6% |
| Interquartile 25% (IQ1) | 12.5% | 16.2% |
| Interquartile 75% (IQ3) | 19.1% | 40.7% |
| Interquartile Range (IQR) | 6.6% | 24.5% |
| Standard Deviation (Sample) | 7.7% | 19.5% |
| Standard Deviation (Population) | 7.6% | 19.3% |
Demographics Similar to U.S. Virgin Islanders and Apache by Female Poverty
In terms of female poverty, the demographic groups most similar to U.S. Virgin Islanders are Honduran (17.4%, a difference of 0.30%), Immigrants from Congo (17.4%, a difference of 0.49%), Ute (17.5%, a difference of 0.82%), Cajun (17.5%, a difference of 0.83%), and Immigrants from Dominica (17.5%, a difference of 0.91%). Similarly, the demographic groups most similar to Apache are Native/Alaskan (19.2%, a difference of 0.16%), Dominican (19.1%, a difference of 0.58%), Immigrants from Dominican Republic (19.3%, a difference of 0.60%), Kiowa (18.6%, a difference of 3.3%), and Black/African American (18.6%, a difference of 3.5%).
| Demographics | Rating | Rank | Female Poverty |
| British West Indians | 0.0 /100 | #313 | Tragic 17.0% |
| Dutch West Indians | 0.0 /100 | #314 | Tragic 17.1% |
| U.S. Virgin Islanders | 0.0 /100 | #315 | Tragic 17.3% |
| Hondurans | 0.0 /100 | #316 | Tragic 17.4% |
| Immigrants | Congo | 0.0 /100 | #317 | Tragic 17.4% |
| Ute | 0.0 /100 | #318 | Tragic 17.5% |
| Cajuns | 0.0 /100 | #319 | Tragic 17.5% |
| Immigrants | Dominica | 0.0 /100 | #320 | Tragic 17.5% |
| Arapaho | 0.0 /100 | #321 | Tragic 17.5% |
| Menominee | 0.0 /100 | #322 | Tragic 17.6% |
| Paiute | 0.0 /100 | #323 | Tragic 17.7% |
| Immigrants | Honduras | 0.0 /100 | #324 | Tragic 17.7% |
| Colville | 0.0 /100 | #325 | Tragic 17.8% |
| Central American Indians | 0.0 /100 | #326 | Tragic 18.0% |
| Yakama | 0.0 /100 | #327 | Tragic 18.0% |
| Blacks/African Americans | 0.0 /100 | #328 | Tragic 18.6% |
| Kiowa | 0.0 /100 | #329 | Tragic 18.6% |
| Dominicans | 0.0 /100 | #330 | Tragic 19.1% |
| Natives/Alaskans | 0.0 /100 | #331 | Tragic 19.2% |
| Apache | 0.0 /100 | #332 | Tragic 19.2% |
| Immigrants | Dominican Republic | 0.0 /100 | #333 | Tragic 19.3% |