Nepalese vs Apache Female Poverty
COMPARE
Nepalese
Apache
Female Poverty
Female Poverty Comparison
Nepalese
Apache
15.2%
FEMALE POVERTY
0.4/ 100
METRIC RATING
242nd/ 347
METRIC RANK
19.2%
FEMALE POVERTY
0.0/ 100
METRIC RATING
332nd/ 347
METRIC RANK
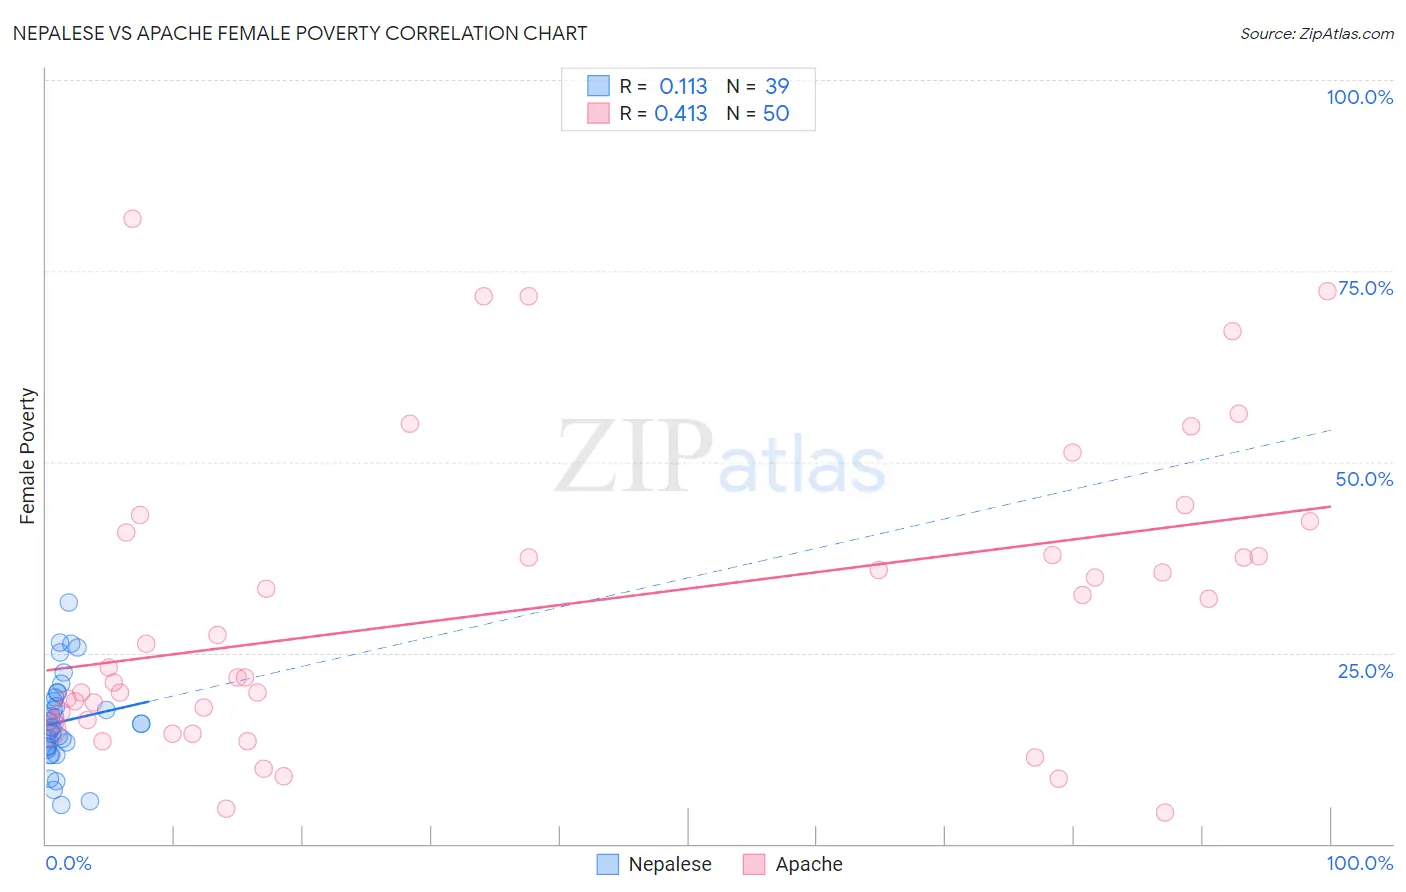
Nepalese vs Apache Female Poverty Correlation Chart
The statistical analysis conducted on geographies consisting of 24,519,269 people shows a poor positive correlation between the proportion of Nepalese and poverty level among females in the United States with a correlation coefficient (R) of 0.113 and weighted average of 15.2%. Similarly, the statistical analysis conducted on geographies consisting of 230,999,825 people shows a moderate positive correlation between the proportion of Apache and poverty level among females in the United States with a correlation coefficient (R) of 0.413 and weighted average of 19.2%, a difference of 26.2%.
Female Poverty Correlation Summary
| Measurement | Nepalese | Apache |
| Minimum | 5.1% | 4.1% |
| Maximum | 31.6% | 81.8% |
| Range | 26.5% | 77.7% |
| Mean | 16.0% | 31.0% |
| Median | 15.3% | 24.6% |
| Interquartile 25% (IQ1) | 12.6% | 16.2% |
| Interquartile 75% (IQ3) | 19.2% | 40.7% |
| Interquartile Range (IQR) | 6.5% | 24.5% |
| Standard Deviation (Sample) | 5.8% | 19.5% |
| Standard Deviation (Population) | 5.8% | 19.3% |
Similar Demographics by Female Poverty
Demographics Similar to Nepalese by Female Poverty
In terms of female poverty, the demographic groups most similar to Nepalese are Immigrants from Sudan (15.2%, a difference of 0.12%), Nicaraguan (15.3%, a difference of 0.24%), Ecuadorian (15.3%, a difference of 0.29%), Sudanese (15.2%, a difference of 0.37%), and Spanish American Indian (15.3%, a difference of 0.39%).
| Demographics | Rating | Rank | Female Poverty |
| Immigrants | Laos | 0.9 /100 | #235 | Tragic 15.0% |
| Cree | 0.7 /100 | #236 | Tragic 15.1% |
| French American Indians | 0.6 /100 | #237 | Tragic 15.1% |
| Immigrants | Armenia | 0.6 /100 | #238 | Tragic 15.1% |
| Immigrants | Middle Africa | 0.5 /100 | #239 | Tragic 15.2% |
| Sudanese | 0.5 /100 | #240 | Tragic 15.2% |
| Immigrants | Sudan | 0.4 /100 | #241 | Tragic 15.2% |
| Nepalese | 0.4 /100 | #242 | Tragic 15.2% |
| Nicaraguans | 0.3 /100 | #243 | Tragic 15.3% |
| Ecuadorians | 0.3 /100 | #244 | Tragic 15.3% |
| Spanish American Indians | 0.3 /100 | #245 | Tragic 15.3% |
| Cubans | 0.3 /100 | #246 | Tragic 15.3% |
| Potawatomi | 0.3 /100 | #247 | Tragic 15.3% |
| Immigrants | Ghana | 0.3 /100 | #248 | Tragic 15.3% |
| Salvadorans | 0.3 /100 | #249 | Tragic 15.3% |
Demographics Similar to Apache by Female Poverty
In terms of female poverty, the demographic groups most similar to Apache are Native/Alaskan (19.2%, a difference of 0.16%), Dominican (19.1%, a difference of 0.58%), Immigrants from Dominican Republic (19.3%, a difference of 0.60%), Kiowa (18.6%, a difference of 3.3%), and Black/African American (18.6%, a difference of 3.5%).
| Demographics | Rating | Rank | Female Poverty |
| Colville | 0.0 /100 | #325 | Tragic 17.8% |
| Central American Indians | 0.0 /100 | #326 | Tragic 18.0% |
| Yakama | 0.0 /100 | #327 | Tragic 18.0% |
| Blacks/African Americans | 0.0 /100 | #328 | Tragic 18.6% |
| Kiowa | 0.0 /100 | #329 | Tragic 18.6% |
| Dominicans | 0.0 /100 | #330 | Tragic 19.1% |
| Natives/Alaskans | 0.0 /100 | #331 | Tragic 19.2% |
| Apache | 0.0 /100 | #332 | Tragic 19.2% |
| Immigrants | Dominican Republic | 0.0 /100 | #333 | Tragic 19.3% |
| Houma | 0.0 /100 | #334 | Tragic 20.0% |
| Cheyenne | 0.0 /100 | #335 | Tragic 20.2% |
| Pueblo | 0.0 /100 | #336 | Tragic 20.7% |
| Yuman | 0.0 /100 | #337 | Tragic 20.8% |
| Sioux | 0.0 /100 | #338 | Tragic 20.9% |
| Hopi | 0.0 /100 | #339 | Tragic 21.0% |