Inupiat vs Dutch Female Poverty
COMPARE
Inupiat
Dutch
Female Poverty
Female Poverty Comparison
Inupiat
Dutch
16.2%
FEMALE POVERTY
0.0/ 100
METRIC RATING
286th/ 347
METRIC RANK
12.4%
FEMALE POVERTY
96.5/ 100
METRIC RATING
86th/ 347
METRIC RANK
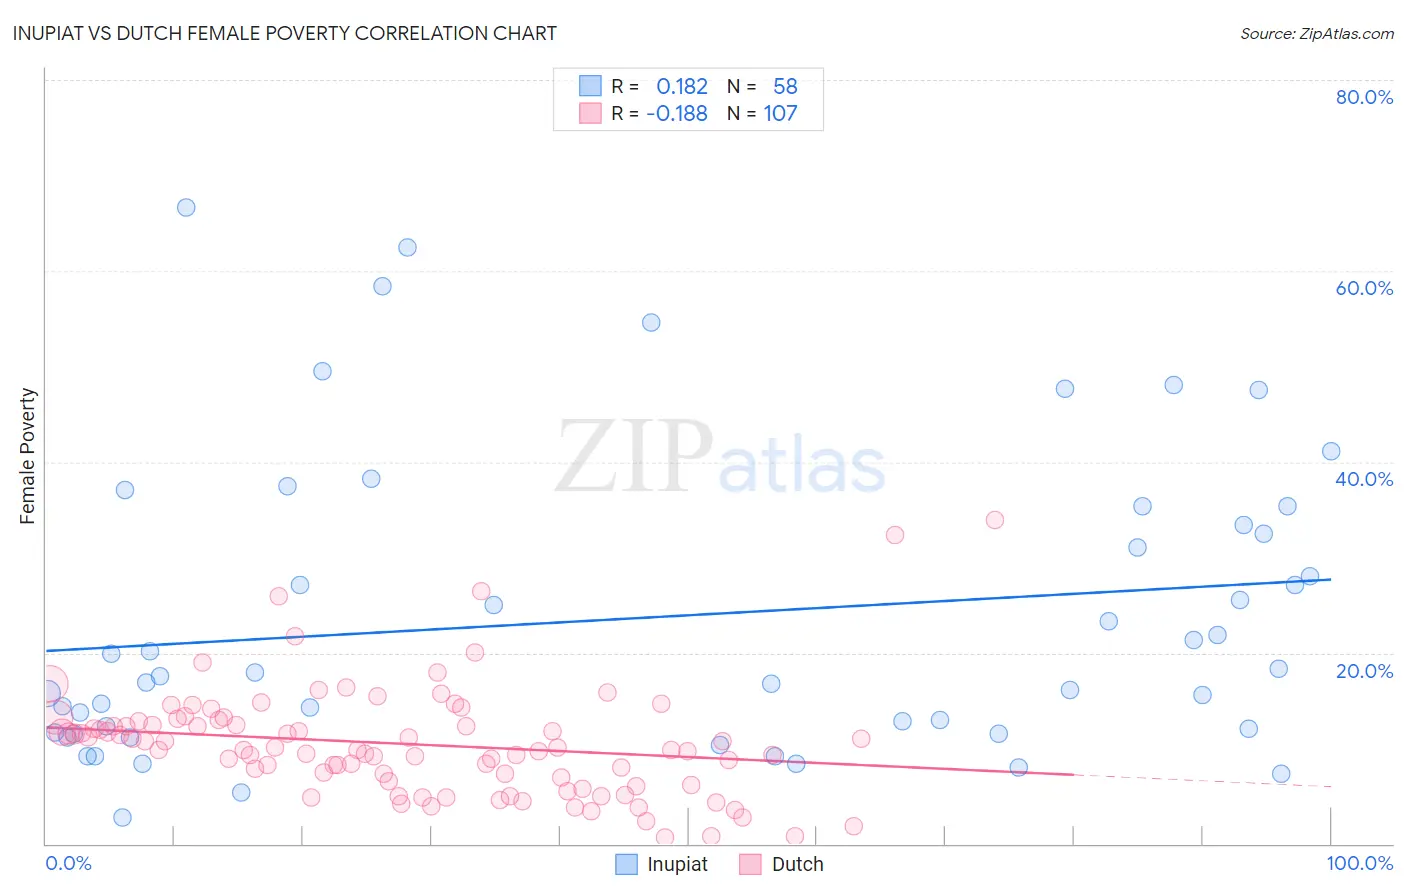
Inupiat vs Dutch Female Poverty Correlation Chart
The statistical analysis conducted on geographies consisting of 96,314,579 people shows a poor positive correlation between the proportion of Inupiat and poverty level among females in the United States with a correlation coefficient (R) of 0.182 and weighted average of 16.2%. Similarly, the statistical analysis conducted on geographies consisting of 553,347,784 people shows a poor negative correlation between the proportion of Dutch and poverty level among females in the United States with a correlation coefficient (R) of -0.188 and weighted average of 12.4%, a difference of 31.3%.
Female Poverty Correlation Summary
| Measurement | Inupiat | Dutch |
| Minimum | 2.8% | 0.60% |
| Maximum | 66.7% | 33.9% |
| Range | 63.9% | 33.3% |
| Mean | 23.7% | 10.5% |
| Median | 17.7% | 9.9% |
| Interquartile 25% (IQ1) | 11.6% | 6.5% |
| Interquartile 75% (IQ3) | 33.3% | 12.8% |
| Interquartile Range (IQR) | 21.7% | 6.3% |
| Standard Deviation (Sample) | 15.6% | 5.8% |
| Standard Deviation (Population) | 15.5% | 5.7% |
Similar Demographics by Female Poverty
Demographics Similar to Inupiat by Female Poverty
In terms of female poverty, the demographic groups most similar to Inupiat are Immigrants from Belize (16.3%, a difference of 0.19%), Comanche (16.2%, a difference of 0.44%), Spanish American (16.2%, a difference of 0.52%), Immigrants from Cuba (16.1%, a difference of 0.57%), and Immigrants from Haiti (16.1%, a difference of 0.65%).
| Demographics | Rating | Rank | Female Poverty |
| Immigrants | Bahamas | 0.0 /100 | #279 | Tragic 16.1% |
| Vietnamese | 0.0 /100 | #280 | Tragic 16.1% |
| West Indians | 0.0 /100 | #281 | Tragic 16.1% |
| Immigrants | Haiti | 0.0 /100 | #282 | Tragic 16.1% |
| Immigrants | Cuba | 0.0 /100 | #283 | Tragic 16.1% |
| Spanish Americans | 0.0 /100 | #284 | Tragic 16.2% |
| Comanche | 0.0 /100 | #285 | Tragic 16.2% |
| Inupiat | 0.0 /100 | #286 | Tragic 16.2% |
| Immigrants | Belize | 0.0 /100 | #287 | Tragic 16.3% |
| Indonesians | 0.0 /100 | #288 | Tragic 16.4% |
| Blackfeet | 0.0 /100 | #289 | Tragic 16.4% |
| Immigrants | Bangladesh | 0.0 /100 | #290 | Tragic 16.4% |
| Yaqui | 0.0 /100 | #291 | Tragic 16.4% |
| Immigrants | Zaire | 0.0 /100 | #292 | Tragic 16.4% |
| Immigrants | Latin America | 0.0 /100 | #293 | Tragic 16.4% |
Demographics Similar to Dutch by Female Poverty
In terms of female poverty, the demographic groups most similar to Dutch are Okinawan (12.4%, a difference of 0.020%), Irish (12.4%, a difference of 0.030%), Finnish (12.4%, a difference of 0.060%), Northern European (12.4%, a difference of 0.080%), and English (12.4%, a difference of 0.26%).
| Demographics | Rating | Rank | Female Poverty |
| Immigrants | North America | 97.1 /100 | #79 | Exceptional 12.3% |
| Slovaks | 97.1 /100 | #80 | Exceptional 12.3% |
| Immigrants | Sweden | 97.1 /100 | #81 | Exceptional 12.3% |
| Jordanians | 97.1 /100 | #82 | Exceptional 12.3% |
| Immigrants | England | 96.9 /100 | #83 | Exceptional 12.3% |
| Northern Europeans | 96.6 /100 | #84 | Exceptional 12.4% |
| Irish | 96.5 /100 | #85 | Exceptional 12.4% |
| Dutch | 96.5 /100 | #86 | Exceptional 12.4% |
| Okinawans | 96.4 /100 | #87 | Exceptional 12.4% |
| Finns | 96.4 /100 | #88 | Exceptional 12.4% |
| English | 96.1 /100 | #89 | Exceptional 12.4% |
| Immigrants | Denmark | 95.8 /100 | #90 | Exceptional 12.4% |
| Belgians | 95.8 /100 | #91 | Exceptional 12.4% |
| Czechoslovakians | 95.7 /100 | #92 | Exceptional 12.4% |
| Immigrants | Egypt | 95.5 /100 | #93 | Exceptional 12.5% |