Immigrants from Venezuela vs Immigrants from Northern Europe Married-Couple Family Poverty
COMPARE
Immigrants from Venezuela
Immigrants from Northern Europe
Married-Couple Family Poverty
Married-Couple Family Poverty Comparison
Immigrants from Venezuela
Immigrants from Northern Europe
5.8%
MARRIED-COUPLE FAMILY POVERTY
1.8/ 100
METRIC RATING
246th/ 347
METRIC RANK
4.2%
MARRIED-COUPLE FAMILY POVERTY
99.8/ 100
METRIC RATING
39th/ 347
METRIC RANK
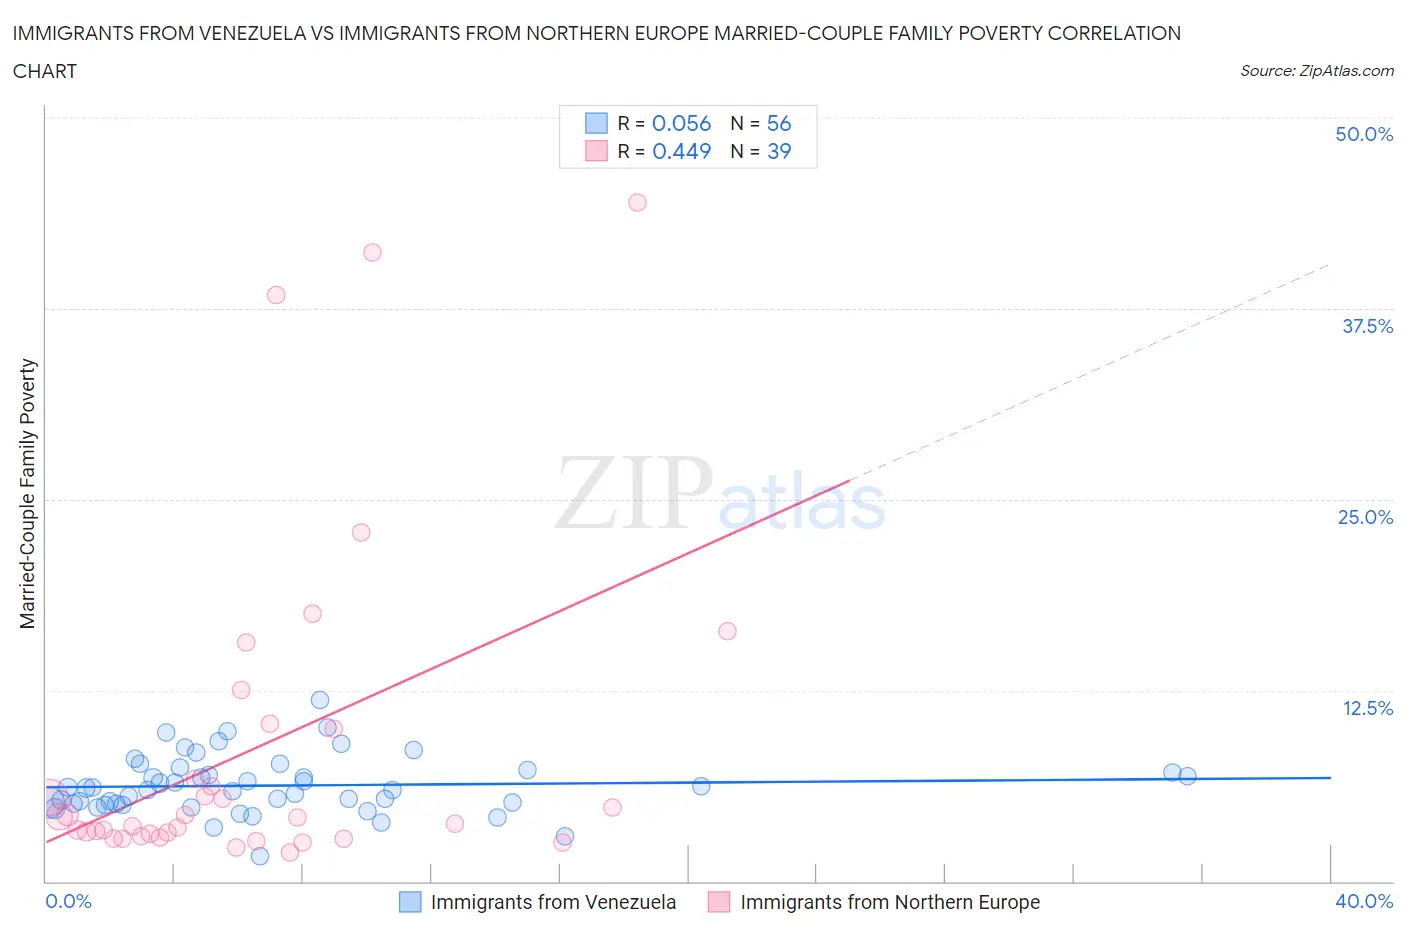
Immigrants from Venezuela vs Immigrants from Northern Europe Married-Couple Family Poverty Correlation Chart
The statistical analysis conducted on geographies consisting of 286,630,688 people shows a slight positive correlation between the proportion of Immigrants from Venezuela and poverty level among married-couple families in the United States with a correlation coefficient (R) of 0.056 and weighted average of 5.8%. Similarly, the statistical analysis conducted on geographies consisting of 470,220,521 people shows a moderate positive correlation between the proportion of Immigrants from Northern Europe and poverty level among married-couple families in the United States with a correlation coefficient (R) of 0.449 and weighted average of 4.2%, a difference of 37.6%.
Married-Couple Family Poverty Correlation Summary
| Measurement | Immigrants from Venezuela | Immigrants from Northern Europe |
| Minimum | 1.7% | 1.9% |
| Maximum | 11.8% | 44.4% |
| Range | 10.2% | 42.6% |
| Mean | 6.3% | 8.6% |
| Median | 6.0% | 4.2% |
| Interquartile 25% (IQ1) | 5.1% | 3.0% |
| Interquartile 75% (IQ3) | 7.2% | 10.0% |
| Interquartile Range (IQR) | 2.1% | 7.0% |
| Standard Deviation (Sample) | 1.9% | 10.7% |
| Standard Deviation (Population) | 1.9% | 10.6% |
Similar Demographics by Married-Couple Family Poverty
Demographics Similar to Immigrants from Venezuela by Married-Couple Family Poverty
In terms of married-couple family poverty, the demographic groups most similar to Immigrants from Venezuela are Immigrants from Afghanistan (5.8%, a difference of 0.52%), Iraqi (5.9%, a difference of 0.62%), Chickasaw (5.8%, a difference of 0.66%), Somali (5.8%, a difference of 0.68%), and Immigrants from Western Africa (5.8%, a difference of 0.83%).
| Demographics | Rating | Rank | Married-Couple Family Poverty |
| Venezuelans | 2.7 /100 | #239 | Tragic 5.8% |
| Fijians | 2.5 /100 | #240 | Tragic 5.8% |
| Immigrants | Panama | 2.5 /100 | #241 | Tragic 5.8% |
| Immigrants | Western Africa | 2.4 /100 | #242 | Tragic 5.8% |
| Somalis | 2.3 /100 | #243 | Tragic 5.8% |
| Chickasaw | 2.3 /100 | #244 | Tragic 5.8% |
| Immigrants | Afghanistan | 2.1 /100 | #245 | Tragic 5.8% |
| Immigrants | Venezuela | 1.8 /100 | #246 | Tragic 5.8% |
| Iraqis | 1.4 /100 | #247 | Tragic 5.9% |
| Cree | 1.2 /100 | #248 | Tragic 5.9% |
| Tsimshian | 1.1 /100 | #249 | Tragic 5.9% |
| Immigrants | Eritrea | 1.1 /100 | #250 | Tragic 5.9% |
| Immigrants | Ghana | 1.0 /100 | #251 | Tragic 5.9% |
| Immigrants | Western Asia | 0.7 /100 | #252 | Tragic 6.0% |
| Africans | 0.7 /100 | #253 | Tragic 6.0% |
Demographics Similar to Immigrants from Northern Europe by Married-Couple Family Poverty
In terms of married-couple family poverty, the demographic groups most similar to Immigrants from Northern Europe are Belgian (4.2%, a difference of 0.13%), Iranian (4.2%, a difference of 0.25%), French Canadian (4.2%, a difference of 0.28%), English (4.2%, a difference of 0.32%), and European (4.2%, a difference of 0.35%).
| Demographics | Rating | Rank | Married-Couple Family Poverty |
| Greeks | 99.9 /100 | #32 | Exceptional 4.2% |
| Irish | 99.9 /100 | #33 | Exceptional 4.2% |
| Dutch | 99.9 /100 | #34 | Exceptional 4.2% |
| Europeans | 99.9 /100 | #35 | Exceptional 4.2% |
| English | 99.9 /100 | #36 | Exceptional 4.2% |
| Iranians | 99.9 /100 | #37 | Exceptional 4.2% |
| Belgians | 99.9 /100 | #38 | Exceptional 4.2% |
| Immigrants | Northern Europe | 99.8 /100 | #39 | Exceptional 4.2% |
| French Canadians | 99.8 /100 | #40 | Exceptional 4.2% |
| Northern Europeans | 99.8 /100 | #41 | Exceptional 4.3% |
| Scottish | 99.8 /100 | #42 | Exceptional 4.3% |
| Swiss | 99.8 /100 | #43 | Exceptional 4.3% |
| Immigrants | Japan | 99.8 /100 | #44 | Exceptional 4.3% |
| Serbians | 99.8 /100 | #45 | Exceptional 4.3% |
| British | 99.8 /100 | #46 | Exceptional 4.3% |