Immigrants from Venezuela vs Immigrants from Northern Europe Single Father Households
COMPARE
Immigrants from Venezuela
Immigrants from Northern Europe
Single Father Households
Single Father Households Comparison
Immigrants from Venezuela
Immigrants from Northern Europe
2.3%
SINGLE FATHER HOUSEHOLDS
83.2/ 100
METRIC RATING
152nd/ 347
METRIC RANK
2.0%
SINGLE FATHER HOUSEHOLDS
99.9/ 100
METRIC RATING
53rd/ 347
METRIC RANK
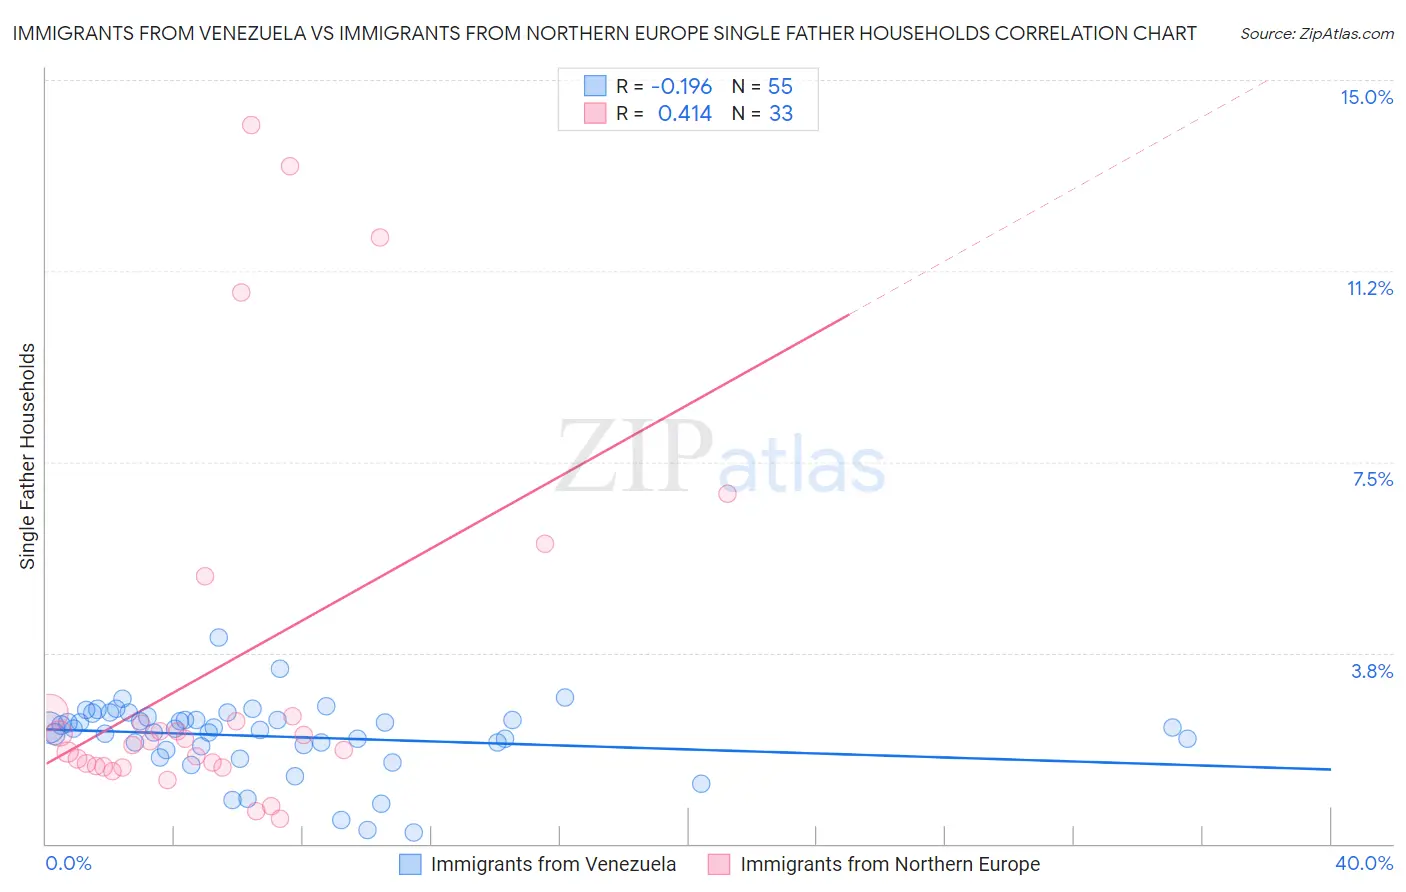
Immigrants from Venezuela vs Immigrants from Northern Europe Single Father Households Correlation Chart
The statistical analysis conducted on geographies consisting of 286,595,714 people shows a poor negative correlation between the proportion of Immigrants from Venezuela and percentage of single father households in the United States with a correlation coefficient (R) of -0.196 and weighted average of 2.3%. Similarly, the statistical analysis conducted on geographies consisting of 470,222,953 people shows a moderate positive correlation between the proportion of Immigrants from Northern Europe and percentage of single father households in the United States with a correlation coefficient (R) of 0.414 and weighted average of 2.0%, a difference of 12.1%.
Single Father Households Correlation Summary
| Measurement | Immigrants from Venezuela | Immigrants from Northern Europe |
| Minimum | 0.23% | 0.50% |
| Maximum | 4.1% | 14.1% |
| Range | 3.8% | 13.6% |
| Mean | 2.1% | 3.4% |
| Median | 2.3% | 2.0% |
| Interquartile 25% (IQ1) | 1.9% | 1.5% |
| Interquartile 75% (IQ3) | 2.5% | 2.5% |
| Interquartile Range (IQR) | 0.58% | 1.0% |
| Standard Deviation (Sample) | 0.71% | 3.7% |
| Standard Deviation (Population) | 0.70% | 3.7% |
Similar Demographics by Single Father Households
Demographics Similar to Immigrants from Venezuela by Single Father Households
In terms of single father households, the demographic groups most similar to Immigrants from Venezuela are Immigrants from Germany (2.3%, a difference of 0.050%), Immigrants from Syria (2.3%, a difference of 0.23%), Bolivian (2.3%, a difference of 0.28%), European (2.3%, a difference of 0.29%), and Immigrants from South America (2.3%, a difference of 0.41%).
| Demographics | Rating | Rank | Single Father Households |
| Immigrants | Zimbabwe | 90.2 /100 | #145 | Exceptional 2.2% |
| Northern Europeans | 89.8 /100 | #146 | Excellent 2.2% |
| Slavs | 88.9 /100 | #147 | Excellent 2.2% |
| South American Indians | 88.5 /100 | #148 | Excellent 2.3% |
| Senegalese | 88.4 /100 | #149 | Excellent 2.3% |
| Venezuelans | 86.2 /100 | #150 | Excellent 2.3% |
| Immigrants | Syria | 84.8 /100 | #151 | Excellent 2.3% |
| Immigrants | Venezuela | 83.2 /100 | #152 | Excellent 2.3% |
| Immigrants | Germany | 82.8 /100 | #153 | Excellent 2.3% |
| Bolivians | 81.0 /100 | #154 | Excellent 2.3% |
| Europeans | 80.9 /100 | #155 | Excellent 2.3% |
| Immigrants | South America | 79.9 /100 | #156 | Good 2.3% |
| Canadians | 79.7 /100 | #157 | Good 2.3% |
| Immigrants | Senegal | 79.4 /100 | #158 | Good 2.3% |
| Immigrants | West Indies | 77.9 /100 | #159 | Good 2.3% |
Demographics Similar to Immigrants from Northern Europe by Single Father Households
In terms of single father households, the demographic groups most similar to Immigrants from Northern Europe are Immigrants from Europe (2.0%, a difference of 0.13%), Immigrants from Korea (2.0%, a difference of 0.14%), Immigrants from France (2.0%, a difference of 0.20%), Immigrants from Norway (2.0%, a difference of 0.22%), and Immigrants from Serbia (2.0%, a difference of 0.38%).
| Demographics | Rating | Rank | Single Father Households |
| Immigrants | Lebanon | 100.0 /100 | #46 | Exceptional 2.0% |
| Immigrants | Ukraine | 99.9 /100 | #47 | Exceptional 2.0% |
| Immigrants | Kazakhstan | 99.9 /100 | #48 | Exceptional 2.0% |
| Immigrants | Serbia | 99.9 /100 | #49 | Exceptional 2.0% |
| Immigrants | Switzerland | 99.9 /100 | #50 | Exceptional 2.0% |
| Immigrants | Poland | 99.9 /100 | #51 | Exceptional 2.0% |
| Immigrants | Europe | 99.9 /100 | #52 | Exceptional 2.0% |
| Immigrants | Northern Europe | 99.9 /100 | #53 | Exceptional 2.0% |
| Immigrants | Korea | 99.9 /100 | #54 | Exceptional 2.0% |
| Immigrants | France | 99.9 /100 | #55 | Exceptional 2.0% |
| Immigrants | Norway | 99.9 /100 | #56 | Exceptional 2.0% |
| Burmese | 99.9 /100 | #57 | Exceptional 2.0% |
| Immigrants | Czechoslovakia | 99.9 /100 | #58 | Exceptional 2.0% |
| Immigrants | North Macedonia | 99.9 /100 | #59 | Exceptional 2.0% |
| Immigrants | Austria | 99.9 /100 | #60 | Exceptional 2.0% |