Immigrants from Senegal vs Immigrants from Northern Europe Married-Couple Family Poverty
COMPARE
Immigrants from Senegal
Immigrants from Northern Europe
Married-Couple Family Poverty
Married-Couple Family Poverty Comparison
Immigrants from Senegal
Immigrants from Northern Europe
6.1%
MARRIED-COUPLE FAMILY POVERTY
0.3/ 100
METRIC RATING
263rd/ 347
METRIC RANK
4.2%
MARRIED-COUPLE FAMILY POVERTY
99.8/ 100
METRIC RATING
39th/ 347
METRIC RANK
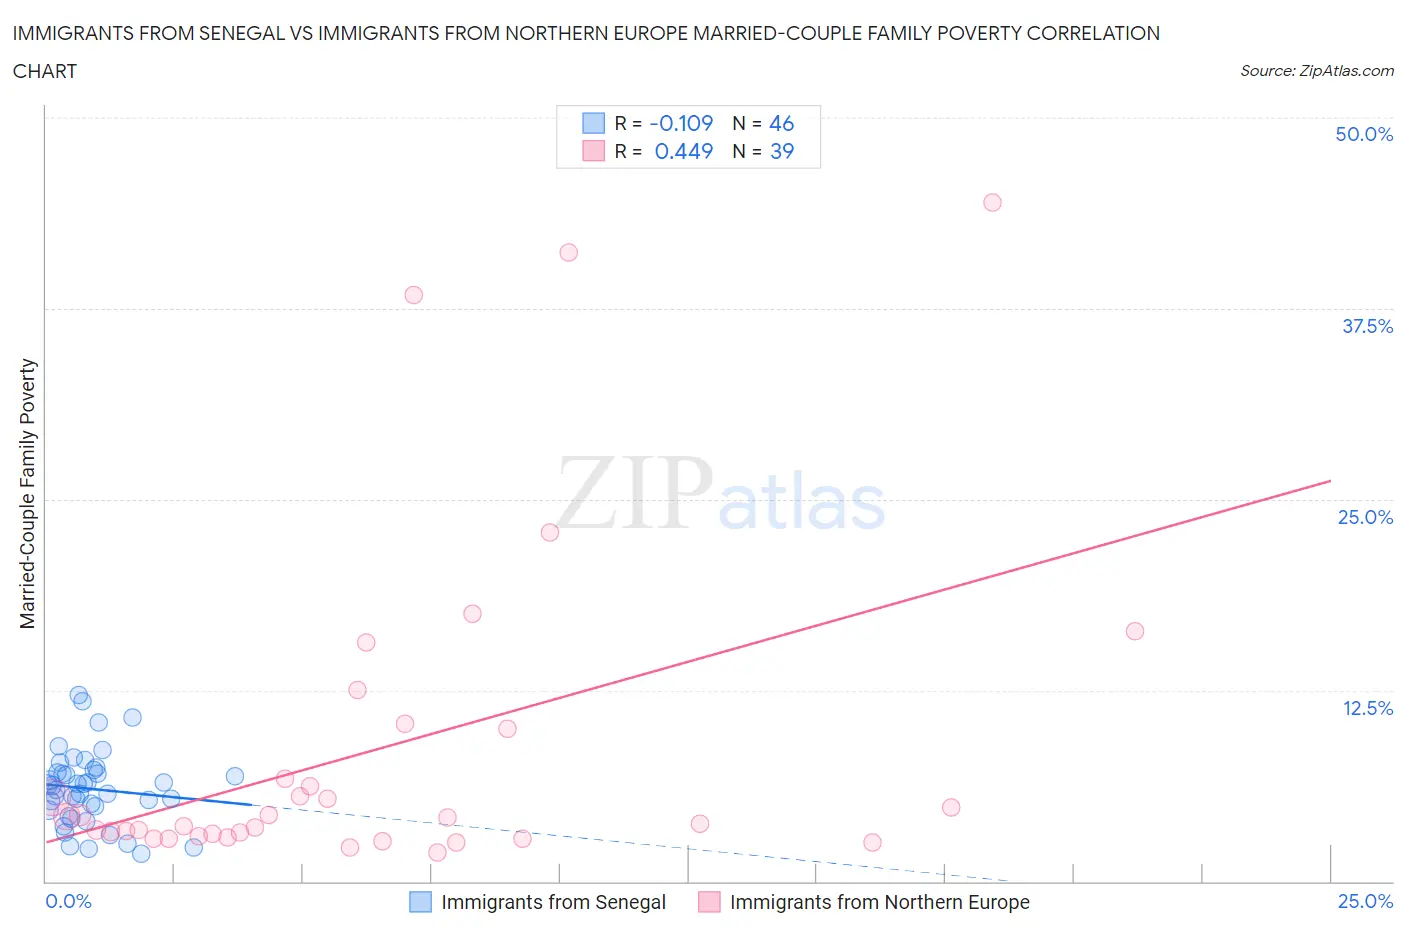
Immigrants from Senegal vs Immigrants from Northern Europe Married-Couple Family Poverty Correlation Chart
The statistical analysis conducted on geographies consisting of 89,915,851 people shows a poor negative correlation between the proportion of Immigrants from Senegal and poverty level among married-couple families in the United States with a correlation coefficient (R) of -0.109 and weighted average of 6.1%. Similarly, the statistical analysis conducted on geographies consisting of 470,220,521 people shows a moderate positive correlation between the proportion of Immigrants from Northern Europe and poverty level among married-couple families in the United States with a correlation coefficient (R) of 0.449 and weighted average of 4.2%, a difference of 44.6%.
Married-Couple Family Poverty Correlation Summary
| Measurement | Immigrants from Senegal | Immigrants from Northern Europe |
| Minimum | 1.8% | 1.9% |
| Maximum | 12.2% | 44.4% |
| Range | 10.4% | 42.6% |
| Mean | 6.1% | 8.6% |
| Median | 6.1% | 4.2% |
| Interquartile 25% (IQ1) | 4.7% | 3.0% |
| Interquartile 75% (IQ3) | 7.1% | 10.0% |
| Interquartile Range (IQR) | 2.5% | 7.0% |
| Standard Deviation (Sample) | 2.4% | 10.7% |
| Standard Deviation (Population) | 2.4% | 10.6% |
Similar Demographics by Married-Couple Family Poverty
Demographics Similar to Immigrants from Senegal by Married-Couple Family Poverty
In terms of married-couple family poverty, the demographic groups most similar to Immigrants from Senegal are Immigrants from Congo (6.1%, a difference of 0.22%), Shoshone (6.1%, a difference of 0.39%), Senegalese (6.1%, a difference of 0.60%), Blackfeet (6.2%, a difference of 0.66%), and Creek (6.2%, a difference of 0.73%).
| Demographics | Rating | Rank | Married-Couple Family Poverty |
| Bangladeshis | 0.5 /100 | #256 | Tragic 6.0% |
| Immigrants | Burma/Myanmar | 0.5 /100 | #257 | Tragic 6.0% |
| Immigrants | Immigrants | 0.5 /100 | #258 | Tragic 6.0% |
| Alaskan Athabascans | 0.4 /100 | #259 | Tragic 6.1% |
| Jamaicans | 0.3 /100 | #260 | Tragic 6.1% |
| Senegalese | 0.3 /100 | #261 | Tragic 6.1% |
| Shoshone | 0.3 /100 | #262 | Tragic 6.1% |
| Immigrants | Senegal | 0.3 /100 | #263 | Tragic 6.1% |
| Immigrants | Congo | 0.2 /100 | #264 | Tragic 6.1% |
| Blackfeet | 0.2 /100 | #265 | Tragic 6.2% |
| Creek | 0.2 /100 | #266 | Tragic 6.2% |
| Spanish Americans | 0.2 /100 | #267 | Tragic 6.2% |
| Alaska Natives | 0.2 /100 | #268 | Tragic 6.2% |
| Immigrants | West Indies | 0.1 /100 | #269 | Tragic 6.2% |
| Immigrants | Jamaica | 0.1 /100 | #270 | Tragic 6.2% |
Demographics Similar to Immigrants from Northern Europe by Married-Couple Family Poverty
In terms of married-couple family poverty, the demographic groups most similar to Immigrants from Northern Europe are Belgian (4.2%, a difference of 0.13%), Iranian (4.2%, a difference of 0.25%), French Canadian (4.2%, a difference of 0.28%), English (4.2%, a difference of 0.32%), and European (4.2%, a difference of 0.35%).
| Demographics | Rating | Rank | Married-Couple Family Poverty |
| Greeks | 99.9 /100 | #32 | Exceptional 4.2% |
| Irish | 99.9 /100 | #33 | Exceptional 4.2% |
| Dutch | 99.9 /100 | #34 | Exceptional 4.2% |
| Europeans | 99.9 /100 | #35 | Exceptional 4.2% |
| English | 99.9 /100 | #36 | Exceptional 4.2% |
| Iranians | 99.9 /100 | #37 | Exceptional 4.2% |
| Belgians | 99.9 /100 | #38 | Exceptional 4.2% |
| Immigrants | Northern Europe | 99.8 /100 | #39 | Exceptional 4.2% |
| French Canadians | 99.8 /100 | #40 | Exceptional 4.2% |
| Northern Europeans | 99.8 /100 | #41 | Exceptional 4.3% |
| Scottish | 99.8 /100 | #42 | Exceptional 4.3% |
| Swiss | 99.8 /100 | #43 | Exceptional 4.3% |
| Immigrants | Japan | 99.8 /100 | #44 | Exceptional 4.3% |
| Serbians | 99.8 /100 | #45 | Exceptional 4.3% |
| British | 99.8 /100 | #46 | Exceptional 4.3% |