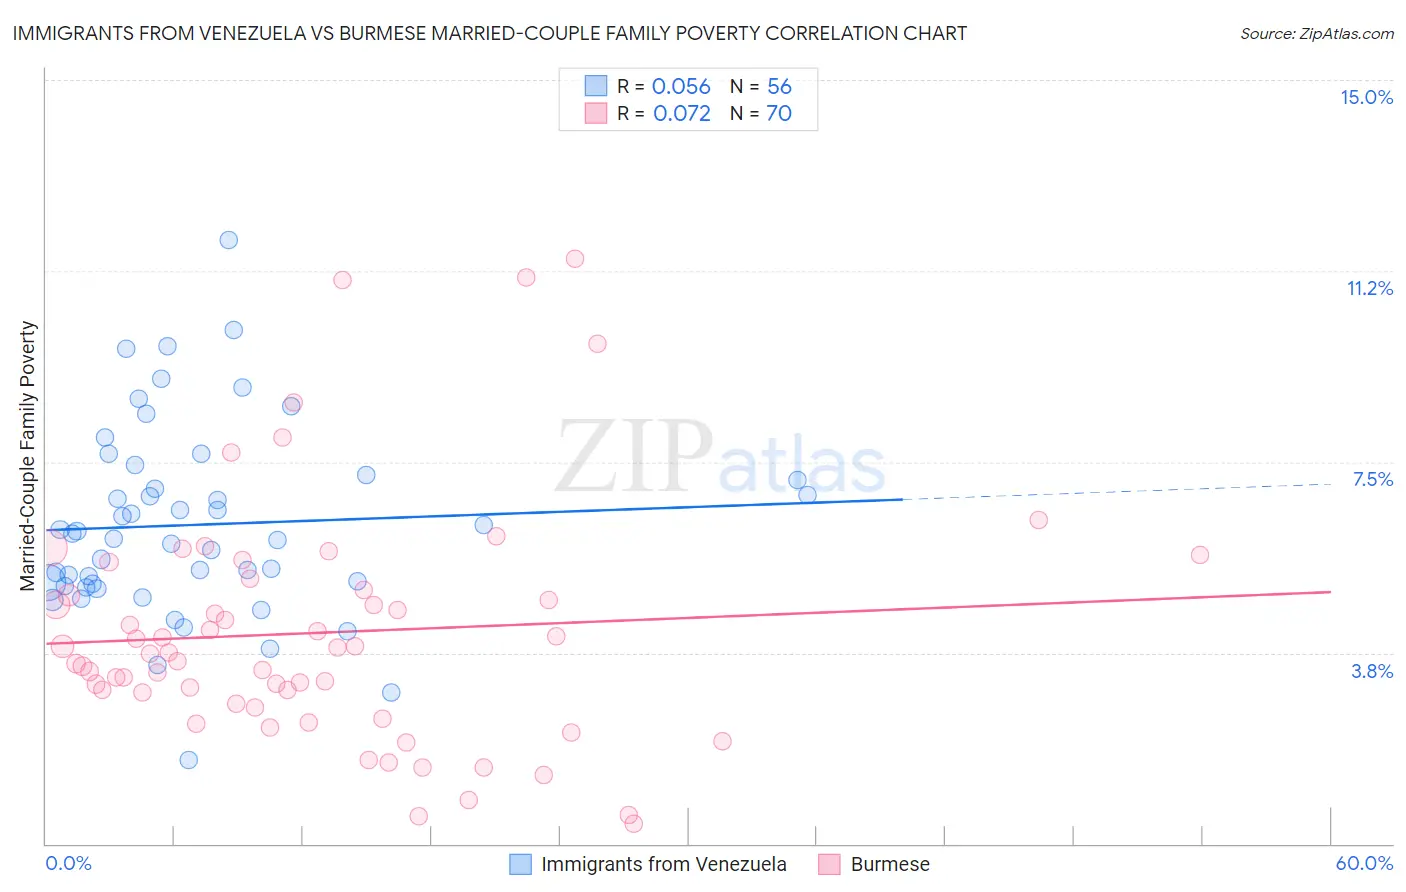
Immigrants from Venezuela vs Burmese Married-Couple Family Poverty
COMPARE
Immigrants from Venezuela
Burmese
Married-Couple Family Poverty
Married-Couple Family Poverty Comparison
Immigrants from Venezuela
Burmese
5.8%
MARRIED-COUPLE FAMILY POVERTY
1.8/ 100
METRIC RATING
246th/ 347
METRIC RANK
4.3%
MARRIED-COUPLE FAMILY POVERTY
99.7/ 100
METRIC RATING
50th/ 347
METRIC RANK
Immigrants from Venezuela vs Burmese Married-Couple Family Poverty Correlation Chart
The statistical analysis conducted on geographies consisting of 286,630,688 people shows a slight positive correlation between the proportion of Immigrants from Venezuela and poverty level among married-couple families in the United States with a correlation coefficient (R) of 0.056 and weighted average of 5.8%. Similarly, the statistical analysis conducted on geographies consisting of 459,334,774 people shows a slight positive correlation between the proportion of Burmese and poverty level among married-couple families in the United States with a correlation coefficient (R) of 0.072 and weighted average of 4.3%, a difference of 34.9%.
Married-Couple Family Poverty Correlation Summary
| Measurement | Immigrants from Venezuela | Burmese |
| Minimum | 1.7% | 0.39% |
| Maximum | 11.8% | 11.5% |
| Range | 10.2% | 11.1% |
| Mean | 6.3% | 4.1% |
| Median | 6.0% | 3.8% |
| Interquartile 25% (IQ1) | 5.1% | 2.8% |
| Interquartile 75% (IQ3) | 7.2% | 5.0% |
| Interquartile Range (IQR) | 2.1% | 2.2% |
| Standard Deviation (Sample) | 1.9% | 2.4% |
| Standard Deviation (Population) | 1.9% | 2.4% |
Similar Demographics by Married-Couple Family Poverty
Demographics Similar to Immigrants from Venezuela by Married-Couple Family Poverty
In terms of married-couple family poverty, the demographic groups most similar to Immigrants from Venezuela are Immigrants from Afghanistan (5.8%, a difference of 0.52%), Iraqi (5.9%, a difference of 0.62%), Chickasaw (5.8%, a difference of 0.66%), Somali (5.8%, a difference of 0.68%), and Immigrants from Western Africa (5.8%, a difference of 0.83%).
| Demographics | Rating | Rank | Married-Couple Family Poverty |
| Venezuelans | 2.7 /100 | #239 | Tragic 5.8% |
| Fijians | 2.5 /100 | #240 | Tragic 5.8% |
| Immigrants | Panama | 2.5 /100 | #241 | Tragic 5.8% |
| Immigrants | Western Africa | 2.4 /100 | #242 | Tragic 5.8% |
| Somalis | 2.3 /100 | #243 | Tragic 5.8% |
| Chickasaw | 2.3 /100 | #244 | Tragic 5.8% |
| Immigrants | Afghanistan | 2.1 /100 | #245 | Tragic 5.8% |
| Immigrants | Venezuela | 1.8 /100 | #246 | Tragic 5.8% |
| Iraqis | 1.4 /100 | #247 | Tragic 5.9% |
| Cree | 1.2 /100 | #248 | Tragic 5.9% |
| Tsimshian | 1.1 /100 | #249 | Tragic 5.9% |
| Immigrants | Eritrea | 1.1 /100 | #250 | Tragic 5.9% |
| Immigrants | Ghana | 1.0 /100 | #251 | Tragic 5.9% |
| Immigrants | Western Asia | 0.7 /100 | #252 | Tragic 6.0% |
| Africans | 0.7 /100 | #253 | Tragic 6.0% |
Demographics Similar to Burmese by Married-Couple Family Poverty
In terms of married-couple family poverty, the demographic groups most similar to Burmese are Immigrants from Lithuania (4.3%, a difference of 0.010%), Russian (4.3%, a difference of 0.040%), Turkish (4.3%, a difference of 0.10%), Australian (4.3%, a difference of 0.18%), and Welsh (4.3%, a difference of 0.19%).
| Demographics | Rating | Rank | Married-Couple Family Poverty |
| Swiss | 99.8 /100 | #43 | Exceptional 4.3% |
| Immigrants | Japan | 99.8 /100 | #44 | Exceptional 4.3% |
| Serbians | 99.8 /100 | #45 | Exceptional 4.3% |
| British | 99.8 /100 | #46 | Exceptional 4.3% |
| Immigrants | South Central Asia | 99.8 /100 | #47 | Exceptional 4.3% |
| Australians | 99.7 /100 | #48 | Exceptional 4.3% |
| Turks | 99.7 /100 | #49 | Exceptional 4.3% |
| Burmese | 99.7 /100 | #50 | Exceptional 4.3% |
| Immigrants | Lithuania | 99.7 /100 | #51 | Exceptional 4.3% |
| Russians | 99.7 /100 | #52 | Exceptional 4.3% |
| Welsh | 99.7 /100 | #53 | Exceptional 4.3% |
| Austrians | 99.7 /100 | #54 | Exceptional 4.3% |
| French | 99.7 /100 | #55 | Exceptional 4.3% |
| Immigrants | Zimbabwe | 99.7 /100 | #56 | Exceptional 4.3% |
| Immigrants | Netherlands | 99.7 /100 | #57 | Exceptional 4.3% |