Immigrants from Uganda vs Shoshone Receiving Food Stamps
COMPARE
Immigrants from Uganda
Shoshone
Receiving Food Stamps
Receiving Food Stamps Comparison
Immigrants from Uganda
Shoshone
11.9%
RECEIVING FOOD STAMPS
40.3/ 100
METRIC RATING
183rd/ 347
METRIC RANK
12.4%
RECEIVING FOOD STAMPS
17.7/ 100
METRIC RATING
203rd/ 347
METRIC RANK
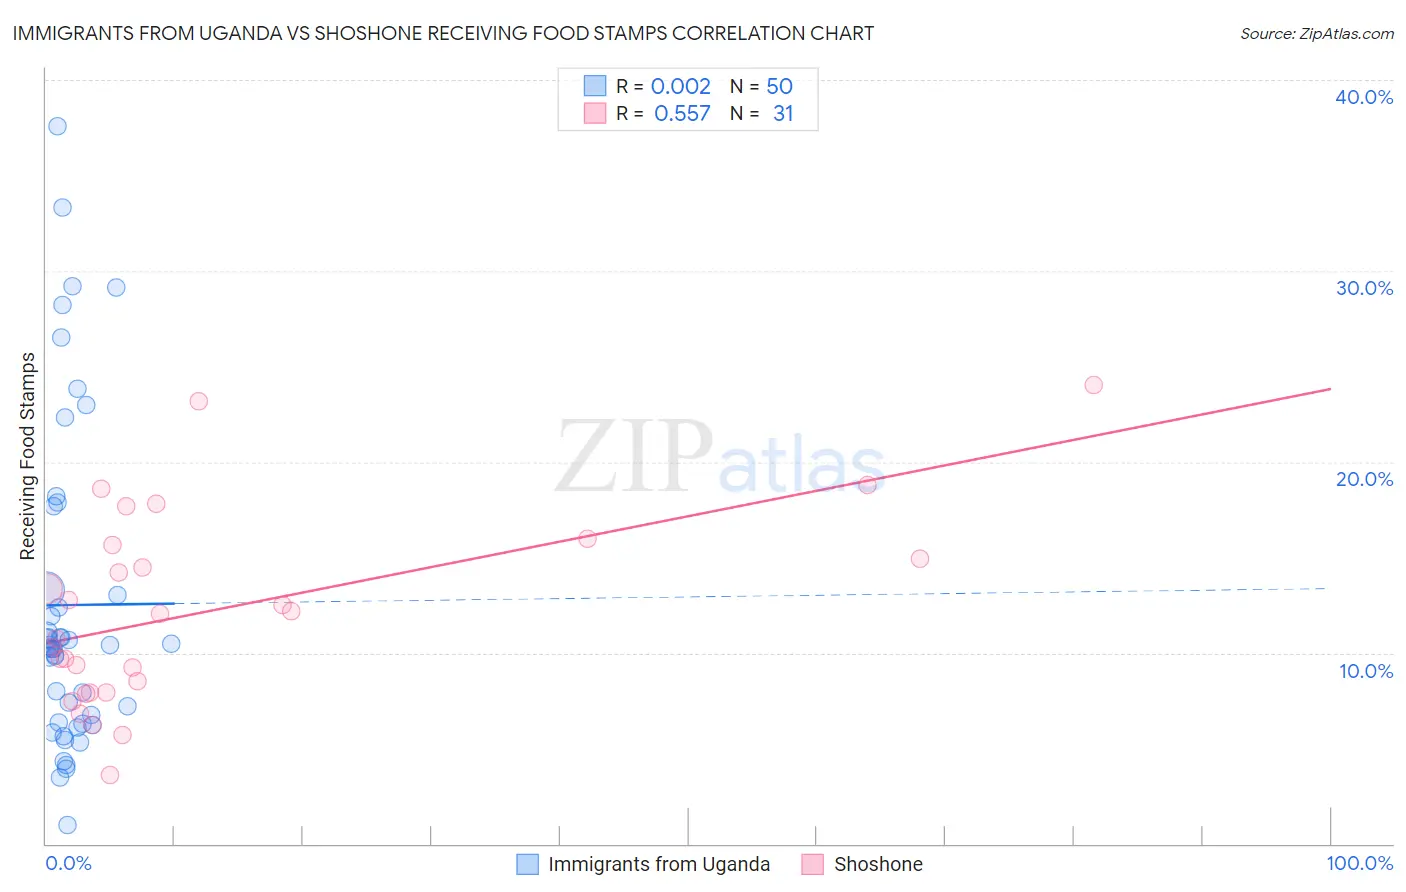
Immigrants from Uganda vs Shoshone Receiving Food Stamps Correlation Chart
The statistical analysis conducted on geographies consisting of 125,947,478 people shows no correlation between the proportion of Immigrants from Uganda and percentage of population receiving government assistance and/or food stamps in the United States with a correlation coefficient (R) of 0.002 and weighted average of 11.9%. Similarly, the statistical analysis conducted on geographies consisting of 66,597,434 people shows a substantial positive correlation between the proportion of Shoshone and percentage of population receiving government assistance and/or food stamps in the United States with a correlation coefficient (R) of 0.557 and weighted average of 12.4%, a difference of 4.0%.
Receiving Food Stamps Correlation Summary
| Measurement | Immigrants from Uganda | Shoshone |
| Minimum | 1.0% | 3.6% |
| Maximum | 37.6% | 24.0% |
| Range | 36.6% | 20.4% |
| Mean | 12.5% | 12.2% |
| Median | 10.3% | 12.0% |
| Interquartile 25% (IQ1) | 6.4% | 7.9% |
| Interquartile 75% (IQ3) | 13.3% | 15.6% |
| Interquartile Range (IQR) | 6.9% | 7.7% |
| Standard Deviation (Sample) | 8.4% | 5.0% |
| Standard Deviation (Population) | 8.3% | 4.9% |
Demographics Similar to Immigrants from Uganda and Shoshone by Receiving Food Stamps
In terms of receiving food stamps, the demographic groups most similar to Immigrants from Uganda are Spaniard (11.9%, a difference of 0.080%), Immigrants from Iraq (12.0%, a difference of 0.46%), Spanish (12.0%, a difference of 0.50%), Albanian (12.0%, a difference of 0.72%), and Sudanese (12.0%, a difference of 1.0%). Similarly, the demographic groups most similar to Shoshone are Immigrants from Venezuela (12.3%, a difference of 0.53%), Ugandan (12.2%, a difference of 1.0%), Sierra Leonean (12.2%, a difference of 1.2%), Portuguese (12.2%, a difference of 1.5%), and Immigrants from Costa Rica (12.2%, a difference of 1.5%).
| Demographics | Rating | Rank | Receiving Food Stamps |
| Immigrants | Uganda | 40.3 /100 | #183 | Average 11.9% |
| Spaniards | 39.8 /100 | #184 | Fair 11.9% |
| Immigrants | Iraq | 37.1 /100 | #185 | Fair 12.0% |
| Spanish | 36.9 /100 | #186 | Fair 12.0% |
| Albanians | 35.4 /100 | #187 | Fair 12.0% |
| Sudanese | 33.4 /100 | #188 | Fair 12.0% |
| Immigrants | Cameroon | 32.5 /100 | #189 | Fair 12.0% |
| Immigrants | Peru | 32.2 /100 | #190 | Fair 12.0% |
| Venezuelans | 32.1 /100 | #191 | Fair 12.0% |
| Samoans | 31.0 /100 | #192 | Fair 12.1% |
| Immigrants | Fiji | 27.8 /100 | #193 | Fair 12.1% |
| Immigrants | Sudan | 27.1 /100 | #194 | Fair 12.1% |
| Americans | 26.7 /100 | #195 | Fair 12.2% |
| Iraqis | 26.6 /100 | #196 | Fair 12.2% |
| Delaware | 26.1 /100 | #197 | Fair 12.2% |
| Immigrants | Costa Rica | 25.4 /100 | #198 | Fair 12.2% |
| Portuguese | 25.1 /100 | #199 | Fair 12.2% |
| Sierra Leoneans | 23.6 /100 | #200 | Fair 12.2% |
| Ugandans | 22.5 /100 | #201 | Fair 12.2% |
| Immigrants | Venezuela | 20.1 /100 | #202 | Fair 12.3% |
| Shoshone | 17.7 /100 | #203 | Poor 12.4% |