Immigrants from Taiwan vs Soviet Union Married-Couple Family Poverty
COMPARE
Immigrants from Taiwan
Soviet Union
Married-Couple Family Poverty
Married-Couple Family Poverty Comparison
Immigrants from Taiwan
Soviet Union
4.1%
MARRIED-COUPLE FAMILY POVERTY
99.9/ 100
METRIC RATING
25th/ 347
METRIC RANK
4.9%
MARRIED-COUPLE FAMILY POVERTY
90.7/ 100
METRIC RATING
130th/ 347
METRIC RANK
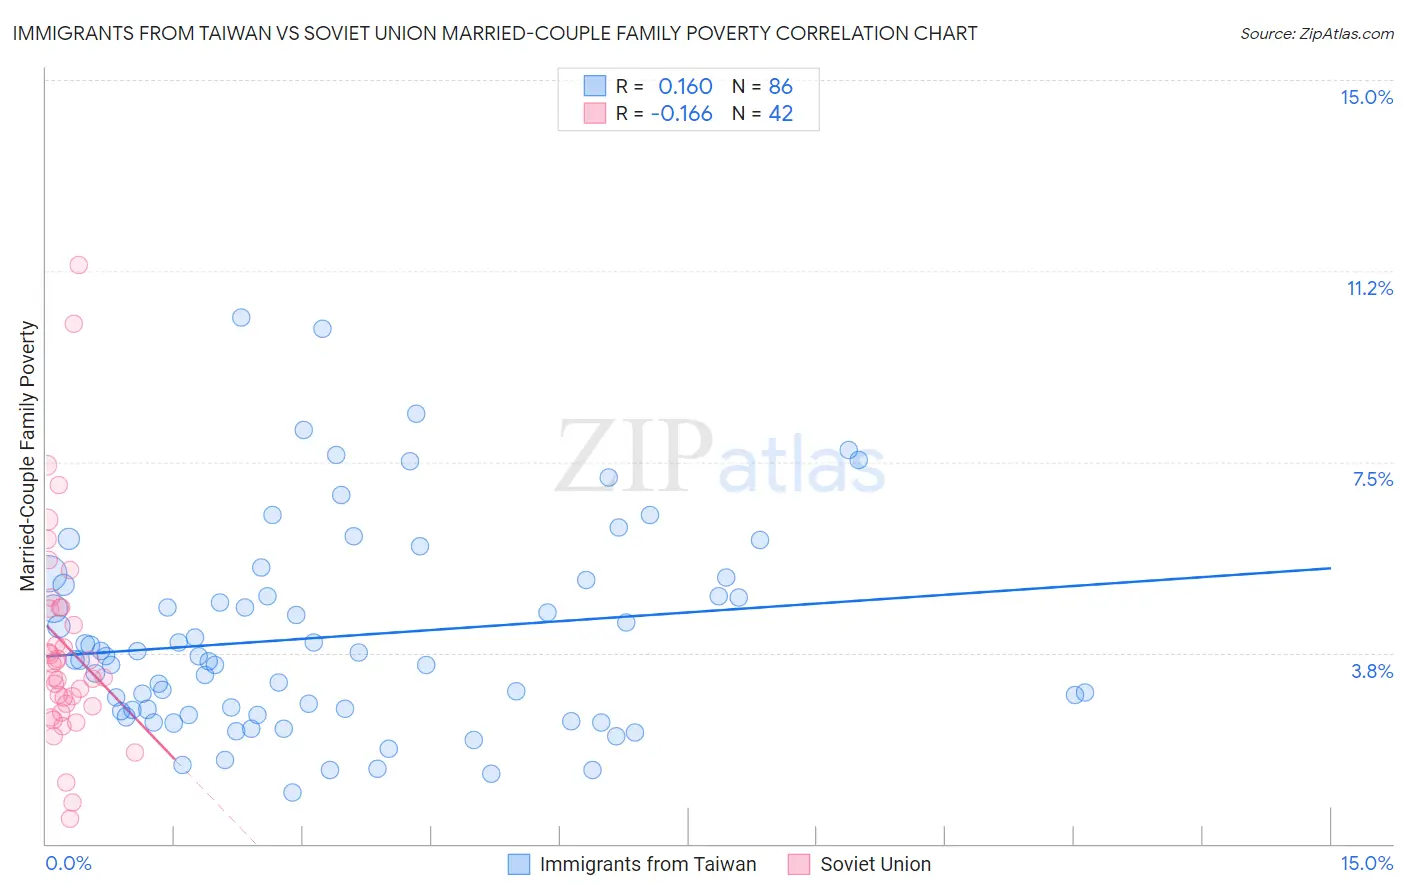
Immigrants from Taiwan vs Soviet Union Married-Couple Family Poverty Correlation Chart
The statistical analysis conducted on geographies consisting of 295,998,361 people shows a poor positive correlation between the proportion of Immigrants from Taiwan and poverty level among married-couple families in the United States with a correlation coefficient (R) of 0.160 and weighted average of 4.1%. Similarly, the statistical analysis conducted on geographies consisting of 43,419,717 people shows a poor negative correlation between the proportion of Soviet Union and poverty level among married-couple families in the United States with a correlation coefficient (R) of -0.166 and weighted average of 4.9%, a difference of 18.0%.
Married-Couple Family Poverty Correlation Summary
| Measurement | Immigrants from Taiwan | Soviet Union |
| Minimum | 1.0% | 0.48% |
| Maximum | 10.3% | 11.4% |
| Range | 9.3% | 10.9% |
| Mean | 4.1% | 3.9% |
| Median | 3.6% | 3.4% |
| Interquartile 25% (IQ1) | 2.6% | 2.7% |
| Interquartile 75% (IQ3) | 5.1% | 4.6% |
| Interquartile Range (IQR) | 2.5% | 1.9% |
| Standard Deviation (Sample) | 2.0% | 2.2% |
| Standard Deviation (Population) | 2.0% | 2.1% |
Similar Demographics by Married-Couple Family Poverty
Demographics Similar to Immigrants from Taiwan by Married-Couple Family Poverty
In terms of married-couple family poverty, the demographic groups most similar to Immigrants from Taiwan are Cypriot (4.1%, a difference of 0.27%), Danish (4.1%, a difference of 0.38%), Scandinavian (4.1%, a difference of 0.49%), Immigrants from Scotland (4.2%, a difference of 0.53%), and Eastern European (4.1%, a difference of 0.57%).
| Demographics | Rating | Rank | Married-Couple Family Poverty |
| Italians | 100.0 /100 | #18 | Exceptional 4.0% |
| Immigrants | Ireland | 99.9 /100 | #19 | Exceptional 4.1% |
| Maltese | 99.9 /100 | #20 | Exceptional 4.1% |
| Zimbabweans | 99.9 /100 | #21 | Exceptional 4.1% |
| Immigrants | Singapore | 99.9 /100 | #22 | Exceptional 4.1% |
| Bhutanese | 99.9 /100 | #23 | Exceptional 4.1% |
| Eastern Europeans | 99.9 /100 | #24 | Exceptional 4.1% |
| Immigrants | Taiwan | 99.9 /100 | #25 | Exceptional 4.1% |
| Cypriots | 99.9 /100 | #26 | Exceptional 4.1% |
| Danes | 99.9 /100 | #27 | Exceptional 4.1% |
| Scandinavians | 99.9 /100 | #28 | Exceptional 4.1% |
| Immigrants | Scotland | 99.9 /100 | #29 | Exceptional 4.2% |
| Finns | 99.9 /100 | #30 | Exceptional 4.2% |
| Estonians | 99.9 /100 | #31 | Exceptional 4.2% |
| Greeks | 99.9 /100 | #32 | Exceptional 4.2% |
Demographics Similar to Soviet Union by Married-Couple Family Poverty
In terms of married-couple family poverty, the demographic groups most similar to Soviet Union are Immigrants from Pakistan (4.9%, a difference of 0.010%), Immigrants from Eastern Europe (4.9%, a difference of 0.070%), Puget Sound Salish (4.9%, a difference of 0.080%), Immigrants from Kenya (4.9%, a difference of 0.15%), and Samoan (4.9%, a difference of 0.16%).
| Demographics | Rating | Rank | Married-Couple Family Poverty |
| Jordanians | 93.1 /100 | #123 | Exceptional 4.8% |
| Romanians | 92.5 /100 | #124 | Exceptional 4.8% |
| Immigrants | Bosnia and Herzegovina | 92.5 /100 | #125 | Exceptional 4.8% |
| Immigrants | Asia | 92.3 /100 | #126 | Exceptional 4.8% |
| Egyptians | 92.0 /100 | #127 | Exceptional 4.8% |
| Palestinians | 91.2 /100 | #128 | Exceptional 4.9% |
| Immigrants | Pakistan | 90.7 /100 | #129 | Exceptional 4.9% |
| Soviet Union | 90.7 /100 | #130 | Exceptional 4.9% |
| Immigrants | Eastern Europe | 90.5 /100 | #131 | Exceptional 4.9% |
| Puget Sound Salish | 90.4 /100 | #132 | Exceptional 4.9% |
| Immigrants | Kenya | 90.2 /100 | #133 | Exceptional 4.9% |
| Samoans | 90.2 /100 | #134 | Exceptional 4.9% |
| Assyrians/Chaldeans/Syriacs | 89.4 /100 | #135 | Excellent 4.9% |
| Immigrants | Hungary | 88.7 /100 | #136 | Excellent 4.9% |
| Guamanians/Chamorros | 86.5 /100 | #137 | Excellent 4.9% |