Basque vs Soviet Union Married-Couple Family Poverty
COMPARE
Basque
Soviet Union
Married-Couple Family Poverty
Married-Couple Family Poverty Comparison
Basques
Soviet Union
4.6%
MARRIED-COUPLE FAMILY POVERTY
98.5/ 100
METRIC RATING
91st/ 347
METRIC RANK
4.9%
MARRIED-COUPLE FAMILY POVERTY
90.7/ 100
METRIC RATING
130th/ 347
METRIC RANK
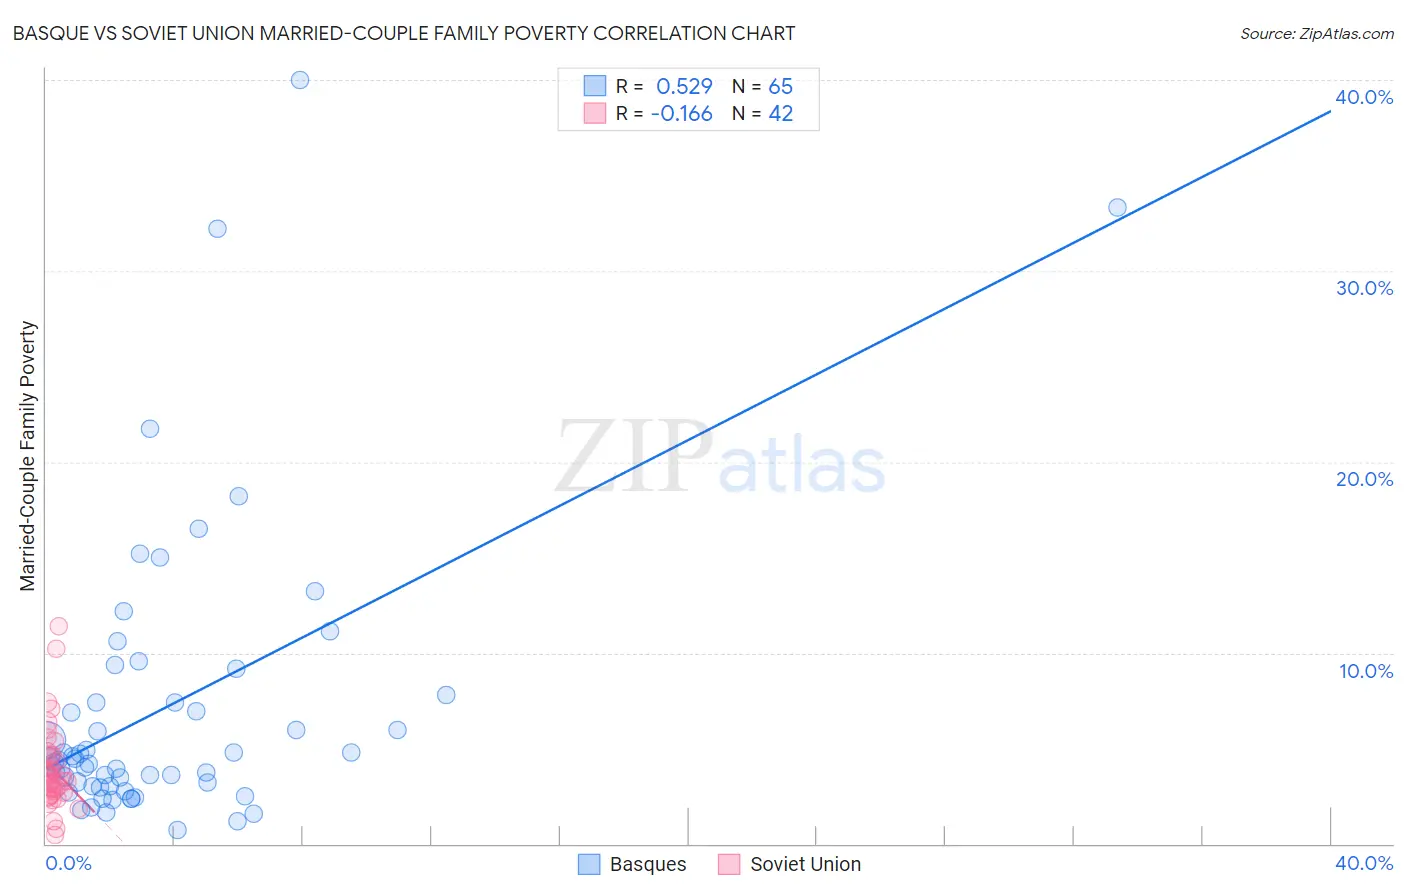
Basque vs Soviet Union Married-Couple Family Poverty Correlation Chart
The statistical analysis conducted on geographies consisting of 165,263,383 people shows a substantial positive correlation between the proportion of Basques and poverty level among married-couple families in the United States with a correlation coefficient (R) of 0.529 and weighted average of 4.6%. Similarly, the statistical analysis conducted on geographies consisting of 43,419,717 people shows a poor negative correlation between the proportion of Soviet Union and poverty level among married-couple families in the United States with a correlation coefficient (R) of -0.166 and weighted average of 4.9%, a difference of 6.2%.
Married-Couple Family Poverty Correlation Summary
| Measurement | Basque | Soviet Union |
| Minimum | 0.72% | 0.48% |
| Maximum | 40.0% | 11.4% |
| Range | 39.3% | 10.9% |
| Mean | 7.1% | 3.9% |
| Median | 4.4% | 3.4% |
| Interquartile 25% (IQ1) | 3.0% | 2.7% |
| Interquartile 75% (IQ3) | 7.6% | 4.6% |
| Interquartile Range (IQR) | 4.6% | 1.9% |
| Standard Deviation (Sample) | 7.6% | 2.2% |
| Standard Deviation (Population) | 7.6% | 2.1% |
Similar Demographics by Married-Couple Family Poverty
Demographics Similar to Basques by Married-Couple Family Poverty
In terms of married-couple family poverty, the demographic groups most similar to Basques are Immigrants from Switzerland (4.6%, a difference of 0.040%), Immigrants from Norway (4.6%, a difference of 0.080%), Immigrants from Czechoslovakia (4.6%, a difference of 0.11%), Bolivian (4.6%, a difference of 0.22%), and Korean (4.6%, a difference of 0.26%).
| Demographics | Rating | Rank | Married-Couple Family Poverty |
| Immigrants | Croatia | 98.7 /100 | #84 | Exceptional 4.6% |
| South Africans | 98.7 /100 | #85 | Exceptional 4.6% |
| Immigrants | Turkey | 98.6 /100 | #86 | Exceptional 4.6% |
| Immigrants | North Macedonia | 98.6 /100 | #87 | Exceptional 4.6% |
| Bolivians | 98.6 /100 | #88 | Exceptional 4.6% |
| Immigrants | Czechoslovakia | 98.5 /100 | #89 | Exceptional 4.6% |
| Immigrants | Switzerland | 98.5 /100 | #90 | Exceptional 4.6% |
| Basques | 98.5 /100 | #91 | Exceptional 4.6% |
| Immigrants | Norway | 98.4 /100 | #92 | Exceptional 4.6% |
| Koreans | 98.3 /100 | #93 | Exceptional 4.6% |
| Immigrants | Italy | 98.3 /100 | #94 | Exceptional 4.6% |
| Portuguese | 98.3 /100 | #95 | Exceptional 4.6% |
| Immigrants | Poland | 98.3 /100 | #96 | Exceptional 4.6% |
| Immigrants | Belgium | 98.2 /100 | #97 | Exceptional 4.6% |
| Native Hawaiians | 98.0 /100 | #98 | Exceptional 4.6% |
Demographics Similar to Soviet Union by Married-Couple Family Poverty
In terms of married-couple family poverty, the demographic groups most similar to Soviet Union are Immigrants from Pakistan (4.9%, a difference of 0.010%), Immigrants from Eastern Europe (4.9%, a difference of 0.070%), Puget Sound Salish (4.9%, a difference of 0.080%), Immigrants from Kenya (4.9%, a difference of 0.15%), and Samoan (4.9%, a difference of 0.16%).
| Demographics | Rating | Rank | Married-Couple Family Poverty |
| Jordanians | 93.1 /100 | #123 | Exceptional 4.8% |
| Romanians | 92.5 /100 | #124 | Exceptional 4.8% |
| Immigrants | Bosnia and Herzegovina | 92.5 /100 | #125 | Exceptional 4.8% |
| Immigrants | Asia | 92.3 /100 | #126 | Exceptional 4.8% |
| Egyptians | 92.0 /100 | #127 | Exceptional 4.8% |
| Palestinians | 91.2 /100 | #128 | Exceptional 4.9% |
| Immigrants | Pakistan | 90.7 /100 | #129 | Exceptional 4.9% |
| Soviet Union | 90.7 /100 | #130 | Exceptional 4.9% |
| Immigrants | Eastern Europe | 90.5 /100 | #131 | Exceptional 4.9% |
| Puget Sound Salish | 90.4 /100 | #132 | Exceptional 4.9% |
| Immigrants | Kenya | 90.2 /100 | #133 | Exceptional 4.9% |
| Samoans | 90.2 /100 | #134 | Exceptional 4.9% |
| Assyrians/Chaldeans/Syriacs | 89.4 /100 | #135 | Excellent 4.9% |
| Immigrants | Hungary | 88.7 /100 | #136 | Excellent 4.9% |
| Guamanians/Chamorros | 86.5 /100 | #137 | Excellent 4.9% |