Immigrants from Taiwan vs Costa Rican Poverty
COMPARE
Immigrants from Taiwan
Costa Rican
Poverty
Poverty Comparison
Immigrants from Taiwan
Costa Ricans
9.7%
POVERTY
100.0/ 100
METRIC RATING
4th/ 347
METRIC RANK
12.2%
POVERTY
62.2/ 100
METRIC RATING
157th/ 347
METRIC RANK
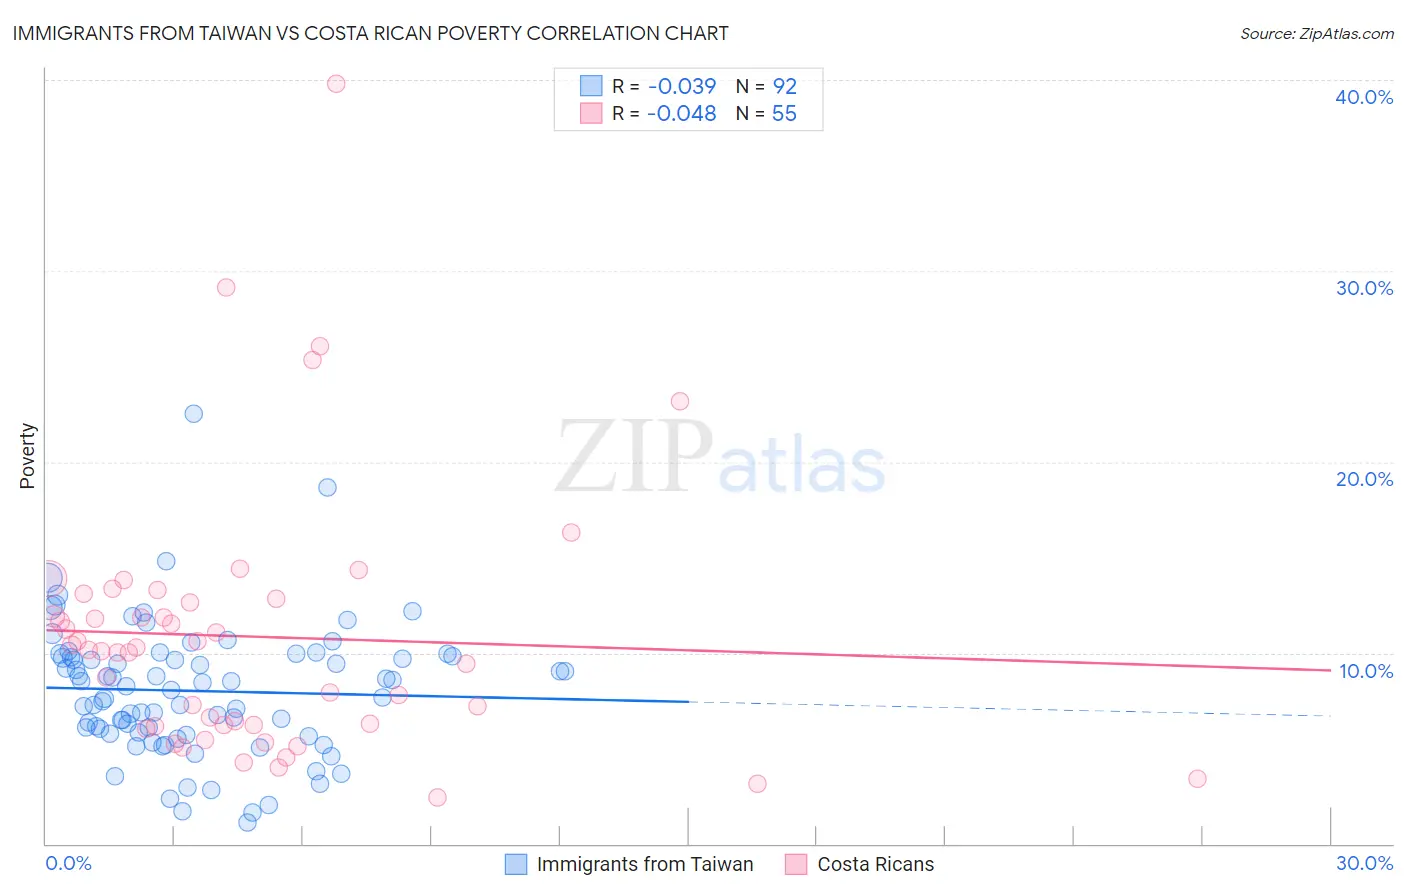
Immigrants from Taiwan vs Costa Rican Poverty Correlation Chart
The statistical analysis conducted on geographies consisting of 298,124,801 people shows no correlation between the proportion of Immigrants from Taiwan and poverty level in the United States with a correlation coefficient (R) of -0.039 and weighted average of 9.7%. Similarly, the statistical analysis conducted on geographies consisting of 253,487,550 people shows no correlation between the proportion of Costa Ricans and poverty level in the United States with a correlation coefficient (R) of -0.048 and weighted average of 12.2%, a difference of 25.1%.
Poverty Correlation Summary
| Measurement | Immigrants from Taiwan | Costa Rican |
| Minimum | 1.1% | 2.4% |
| Maximum | 22.5% | 39.8% |
| Range | 21.4% | 37.4% |
| Mean | 8.0% | 10.8% |
| Median | 8.2% | 10.2% |
| Interquartile 25% (IQ1) | 5.8% | 6.2% |
| Interquartile 75% (IQ3) | 9.8% | 12.8% |
| Interquartile Range (IQR) | 4.0% | 6.6% |
| Standard Deviation (Sample) | 3.5% | 6.9% |
| Standard Deviation (Population) | 3.5% | 6.8% |
Similar Demographics by Poverty
Demographics Similar to Immigrants from Taiwan by Poverty
In terms of poverty, the demographic groups most similar to Immigrants from Taiwan are Thai (9.6%, a difference of 1.5%), Chinese (9.5%, a difference of 1.9%), Immigrants from Ireland (10.1%, a difference of 3.7%), Assyrian/Chaldean/Syriac (10.1%, a difference of 3.8%), and Filipino (10.1%, a difference of 4.0%).
| Demographics | Rating | Rank | Poverty |
| Immigrants | India | 100.0 /100 | #1 | Exceptional 9.0% |
| Chinese | 100.0 /100 | #2 | Exceptional 9.5% |
| Thais | 100.0 /100 | #3 | Exceptional 9.6% |
| Immigrants | Taiwan | 100.0 /100 | #4 | Exceptional 9.7% |
| Immigrants | Ireland | 99.9 /100 | #5 | Exceptional 10.1% |
| Assyrians/Chaldeans/Syriacs | 99.9 /100 | #6 | Exceptional 10.1% |
| Filipinos | 99.9 /100 | #7 | Exceptional 10.1% |
| Maltese | 99.9 /100 | #8 | Exceptional 10.2% |
| Immigrants | South Central Asia | 99.9 /100 | #9 | Exceptional 10.2% |
| Bulgarians | 99.9 /100 | #10 | Exceptional 10.2% |
| Immigrants | Lithuania | 99.9 /100 | #11 | Exceptional 10.3% |
| Bhutanese | 99.8 /100 | #12 | Exceptional 10.4% |
| Immigrants | Hong Kong | 99.8 /100 | #13 | Exceptional 10.4% |
| Immigrants | Bolivia | 99.8 /100 | #14 | Exceptional 10.4% |
| Bolivians | 99.8 /100 | #15 | Exceptional 10.4% |
Demographics Similar to Costa Ricans by Poverty
In terms of poverty, the demographic groups most similar to Costa Ricans are Scotch-Irish (12.2%, a difference of 0.040%), Taiwanese (12.2%, a difference of 0.040%), Pennsylvania German (12.2%, a difference of 0.14%), Hungarian (12.2%, a difference of 0.15%), and Immigrants from Northern Africa (12.1%, a difference of 0.18%).
| Demographics | Rating | Rank | Poverty |
| Immigrants | Kazakhstan | 72.3 /100 | #150 | Good 12.0% |
| Samoans | 71.9 /100 | #151 | Good 12.0% |
| Armenians | 67.6 /100 | #152 | Good 12.1% |
| Immigrants | Northern Africa | 63.9 /100 | #153 | Good 12.1% |
| Guamanians/Chamorros | 63.9 /100 | #154 | Good 12.1% |
| Hungarians | 63.6 /100 | #155 | Good 12.2% |
| Scotch-Irish | 62.6 /100 | #156 | Good 12.2% |
| Costa Ricans | 62.2 /100 | #157 | Good 12.2% |
| Taiwanese | 61.8 /100 | #158 | Good 12.2% |
| Pennsylvania Germans | 60.8 /100 | #159 | Good 12.2% |
| Immigrants | Nepal | 60.4 /100 | #160 | Good 12.2% |
| Immigrants | Fiji | 59.1 /100 | #161 | Average 12.2% |
| Ethiopians | 59.1 /100 | #162 | Average 12.2% |
| Immigrants | Ethiopia | 58.6 /100 | #163 | Average 12.2% |
| Colombians | 57.8 /100 | #164 | Average 12.2% |