Immigrants from Taiwan vs Asian Poverty
COMPARE
Immigrants from Taiwan
Asian
Poverty
Poverty Comparison
Immigrants from Taiwan
Asians
9.7%
POVERTY
100.0/ 100
METRIC RATING
4th/ 347
METRIC RANK
11.0%
POVERTY
98.9/ 100
METRIC RATING
50th/ 347
METRIC RANK
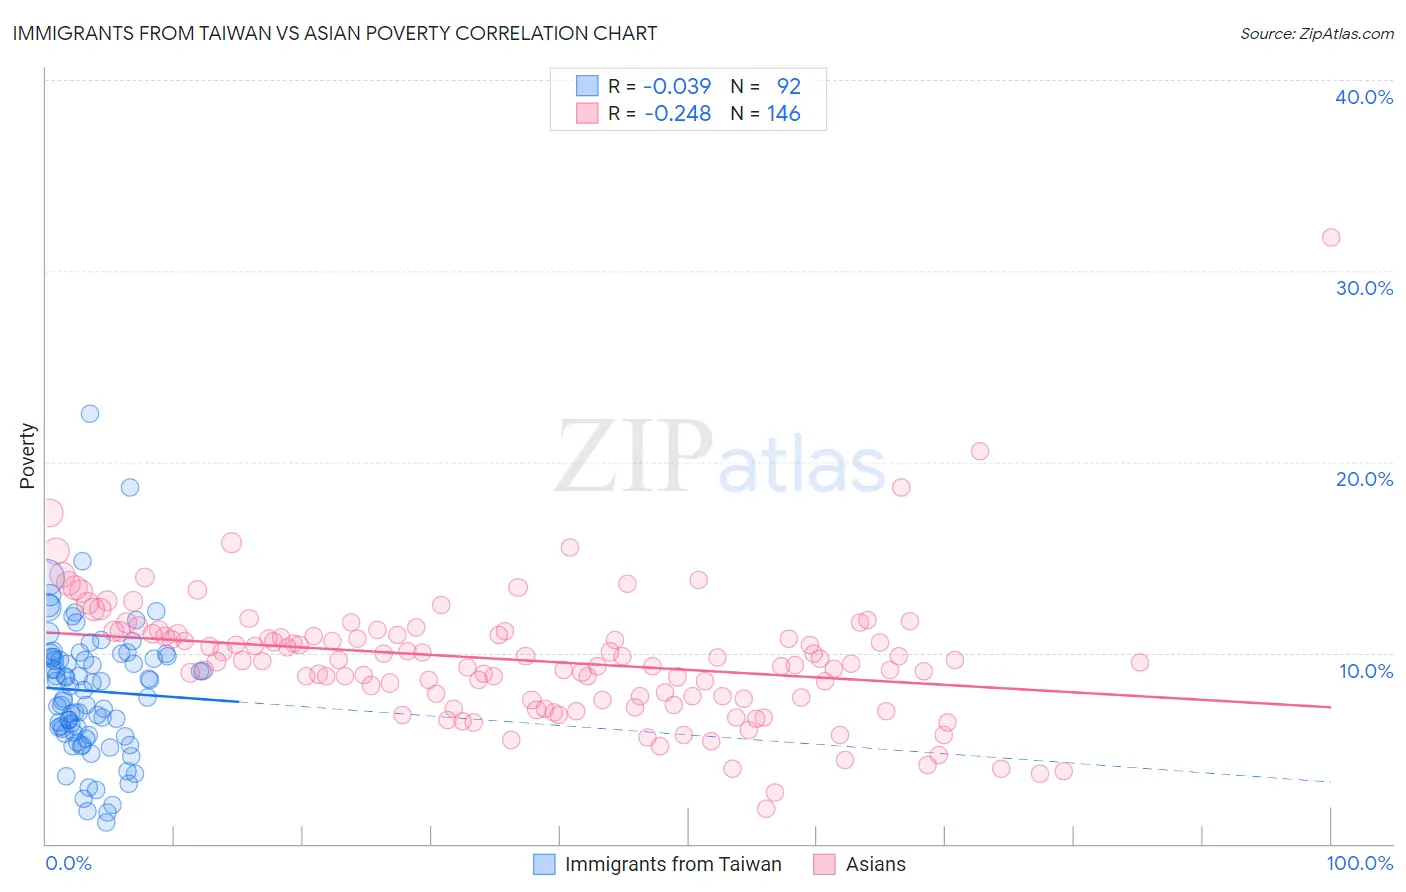
Immigrants from Taiwan vs Asian Poverty Correlation Chart
The statistical analysis conducted on geographies consisting of 298,124,801 people shows no correlation between the proportion of Immigrants from Taiwan and poverty level in the United States with a correlation coefficient (R) of -0.039 and weighted average of 9.7%. Similarly, the statistical analysis conducted on geographies consisting of 550,188,892 people shows a weak negative correlation between the proportion of Asians and poverty level in the United States with a correlation coefficient (R) of -0.248 and weighted average of 11.0%, a difference of 12.9%.
Poverty Correlation Summary
| Measurement | Immigrants from Taiwan | Asian |
| Minimum | 1.1% | 1.8% |
| Maximum | 22.5% | 31.8% |
| Range | 21.4% | 29.9% |
| Mean | 8.0% | 9.6% |
| Median | 8.2% | 9.6% |
| Interquartile 25% (IQ1) | 5.8% | 7.6% |
| Interquartile 75% (IQ3) | 9.8% | 11.0% |
| Interquartile Range (IQR) | 4.0% | 3.4% |
| Standard Deviation (Sample) | 3.5% | 3.5% |
| Standard Deviation (Population) | 3.5% | 3.5% |
Similar Demographics by Poverty
Demographics Similar to Immigrants from Taiwan by Poverty
In terms of poverty, the demographic groups most similar to Immigrants from Taiwan are Thai (9.6%, a difference of 1.5%), Chinese (9.5%, a difference of 1.9%), Immigrants from Ireland (10.1%, a difference of 3.7%), Assyrian/Chaldean/Syriac (10.1%, a difference of 3.8%), and Filipino (10.1%, a difference of 4.0%).
| Demographics | Rating | Rank | Poverty |
| Immigrants | India | 100.0 /100 | #1 | Exceptional 9.0% |
| Chinese | 100.0 /100 | #2 | Exceptional 9.5% |
| Thais | 100.0 /100 | #3 | Exceptional 9.6% |
| Immigrants | Taiwan | 100.0 /100 | #4 | Exceptional 9.7% |
| Immigrants | Ireland | 99.9 /100 | #5 | Exceptional 10.1% |
| Assyrians/Chaldeans/Syriacs | 99.9 /100 | #6 | Exceptional 10.1% |
| Filipinos | 99.9 /100 | #7 | Exceptional 10.1% |
| Maltese | 99.9 /100 | #8 | Exceptional 10.2% |
| Immigrants | South Central Asia | 99.9 /100 | #9 | Exceptional 10.2% |
| Bulgarians | 99.9 /100 | #10 | Exceptional 10.2% |
| Immigrants | Lithuania | 99.9 /100 | #11 | Exceptional 10.3% |
| Bhutanese | 99.8 /100 | #12 | Exceptional 10.4% |
| Immigrants | Hong Kong | 99.8 /100 | #13 | Exceptional 10.4% |
| Immigrants | Bolivia | 99.8 /100 | #14 | Exceptional 10.4% |
| Bolivians | 99.8 /100 | #15 | Exceptional 10.4% |
Demographics Similar to Asians by Poverty
In terms of poverty, the demographic groups most similar to Asians are Immigrants from Japan (11.0%, a difference of 0.030%), Slovene (11.0%, a difference of 0.040%), Immigrants from Romania (11.0%, a difference of 0.080%), Immigrants from Czechoslovakia (11.0%, a difference of 0.10%), and Turkish (11.0%, a difference of 0.18%).
| Demographics | Rating | Rank | Poverty |
| Immigrants | Singapore | 99.2 /100 | #43 | Exceptional 10.9% |
| Immigrants | Moldova | 99.1 /100 | #44 | Exceptional 10.9% |
| Turks | 98.9 /100 | #45 | Exceptional 11.0% |
| Immigrants | Czechoslovakia | 98.9 /100 | #46 | Exceptional 11.0% |
| Immigrants | Romania | 98.9 /100 | #47 | Exceptional 11.0% |
| Slovenes | 98.9 /100 | #48 | Exceptional 11.0% |
| Immigrants | Japan | 98.9 /100 | #49 | Exceptional 11.0% |
| Asians | 98.9 /100 | #50 | Exceptional 11.0% |
| Immigrants | Croatia | 98.7 /100 | #51 | Exceptional 11.0% |
| Immigrants | Philippines | 98.7 /100 | #52 | Exceptional 11.0% |
| Immigrants | Austria | 98.6 /100 | #53 | Exceptional 11.1% |
| Immigrants | Bulgaria | 98.5 /100 | #54 | Exceptional 11.1% |
| Immigrants | Serbia | 98.5 /100 | #55 | Exceptional 11.1% |
| Estonians | 98.2 /100 | #56 | Exceptional 11.1% |
| Scandinavians | 98.2 /100 | #57 | Exceptional 11.1% |