Immigrants from Taiwan vs Lebanese Poverty
COMPARE
Immigrants from Taiwan
Lebanese
Poverty
Poverty Comparison
Immigrants from Taiwan
Lebanese
9.7%
POVERTY
100.0/ 100
METRIC RATING
4th/ 347
METRIC RANK
12.3%
POVERTY
50.0/ 100
METRIC RATING
174th/ 347
METRIC RANK
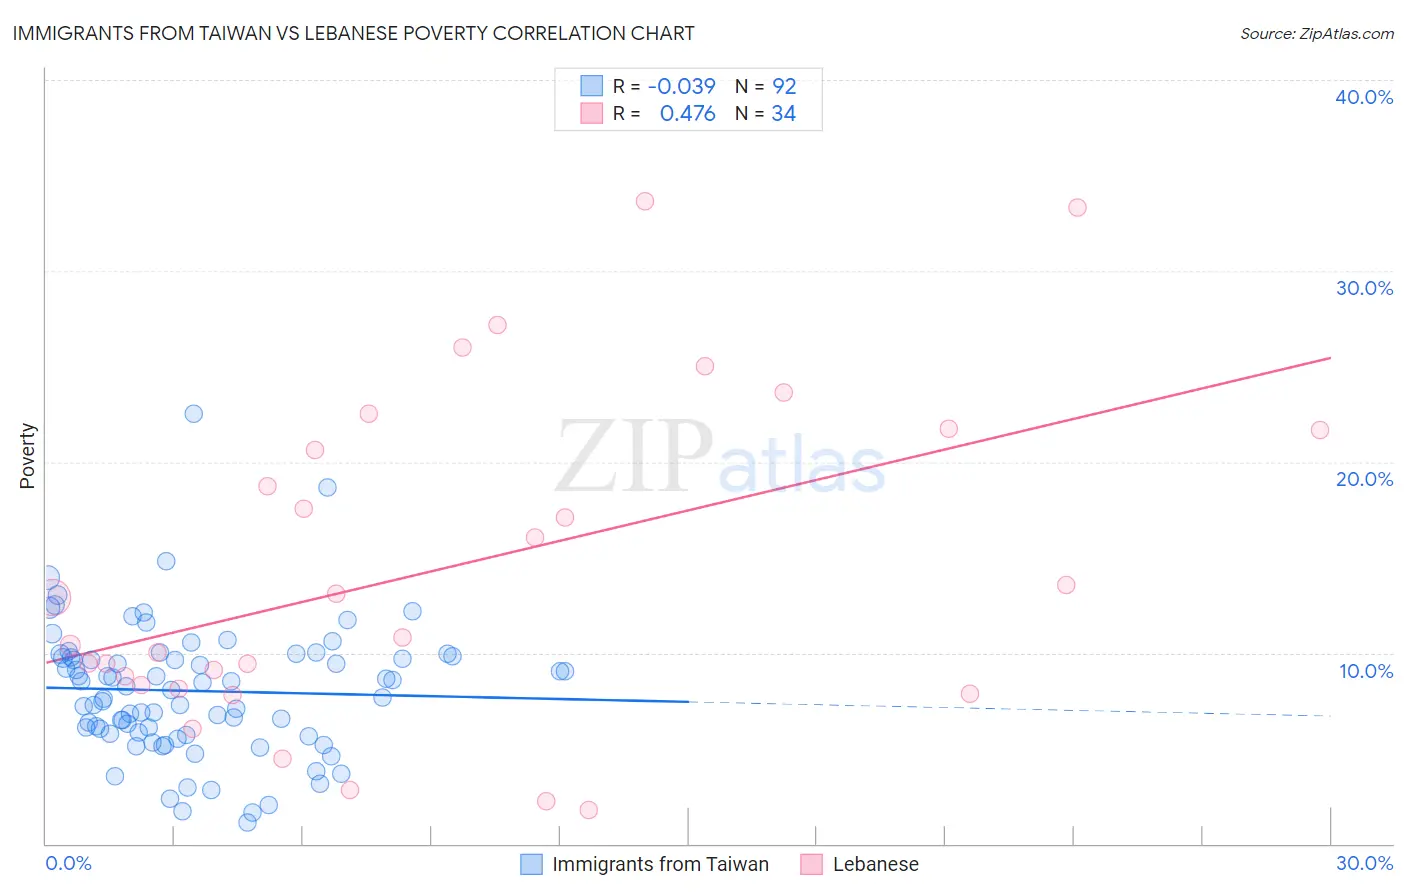
Immigrants from Taiwan vs Lebanese Poverty Correlation Chart
The statistical analysis conducted on geographies consisting of 298,124,801 people shows no correlation between the proportion of Immigrants from Taiwan and poverty level in the United States with a correlation coefficient (R) of -0.039 and weighted average of 9.7%. Similarly, the statistical analysis conducted on geographies consisting of 401,338,667 people shows a moderate positive correlation between the proportion of Lebanese and poverty level in the United States with a correlation coefficient (R) of 0.476 and weighted average of 12.3%, a difference of 26.6%.
Poverty Correlation Summary
| Measurement | Immigrants from Taiwan | Lebanese |
| Minimum | 1.1% | 1.8% |
| Maximum | 22.5% | 33.6% |
| Range | 21.4% | 31.8% |
| Mean | 8.0% | 14.4% |
| Median | 8.2% | 11.8% |
| Interquartile 25% (IQ1) | 5.8% | 8.3% |
| Interquartile 75% (IQ3) | 9.8% | 21.7% |
| Interquartile Range (IQR) | 4.0% | 13.4% |
| Standard Deviation (Sample) | 3.5% | 8.6% |
| Standard Deviation (Population) | 3.5% | 8.5% |
Similar Demographics by Poverty
Demographics Similar to Immigrants from Taiwan by Poverty
In terms of poverty, the demographic groups most similar to Immigrants from Taiwan are Thai (9.6%, a difference of 1.5%), Chinese (9.5%, a difference of 1.9%), Immigrants from Ireland (10.1%, a difference of 3.7%), Assyrian/Chaldean/Syriac (10.1%, a difference of 3.8%), and Filipino (10.1%, a difference of 4.0%).
| Demographics | Rating | Rank | Poverty |
| Immigrants | India | 100.0 /100 | #1 | Exceptional 9.0% |
| Chinese | 100.0 /100 | #2 | Exceptional 9.5% |
| Thais | 100.0 /100 | #3 | Exceptional 9.6% |
| Immigrants | Taiwan | 100.0 /100 | #4 | Exceptional 9.7% |
| Immigrants | Ireland | 99.9 /100 | #5 | Exceptional 10.1% |
| Assyrians/Chaldeans/Syriacs | 99.9 /100 | #6 | Exceptional 10.1% |
| Filipinos | 99.9 /100 | #7 | Exceptional 10.1% |
| Maltese | 99.9 /100 | #8 | Exceptional 10.2% |
| Immigrants | South Central Asia | 99.9 /100 | #9 | Exceptional 10.2% |
| Bulgarians | 99.9 /100 | #10 | Exceptional 10.2% |
| Immigrants | Lithuania | 99.9 /100 | #11 | Exceptional 10.3% |
| Bhutanese | 99.8 /100 | #12 | Exceptional 10.4% |
| Immigrants | Hong Kong | 99.8 /100 | #13 | Exceptional 10.4% |
| Immigrants | Bolivia | 99.8 /100 | #14 | Exceptional 10.4% |
| Bolivians | 99.8 /100 | #15 | Exceptional 10.4% |
Demographics Similar to Lebanese by Poverty
In terms of poverty, the demographic groups most similar to Lebanese are Celtic (12.3%, a difference of 0.010%), Immigrants from Portugal (12.3%, a difference of 0.050%), Immigrants from Spain (12.3%, a difference of 0.12%), South American (12.3%, a difference of 0.13%), and Immigrants from Colombia (12.3%, a difference of 0.23%).
| Demographics | Rating | Rank | Poverty |
| Immigrants | Chile | 56.7 /100 | #167 | Average 12.2% |
| Immigrants | Venezuela | 56.5 /100 | #168 | Average 12.2% |
| Whites/Caucasians | 55.4 /100 | #169 | Average 12.3% |
| Immigrants | Oceania | 54.6 /100 | #170 | Average 12.3% |
| Immigrants | Spain | 51.3 /100 | #171 | Average 12.3% |
| Immigrants | Portugal | 50.5 /100 | #172 | Average 12.3% |
| Celtics | 50.1 /100 | #173 | Average 12.3% |
| Lebanese | 50.0 /100 | #174 | Average 12.3% |
| South Americans | 48.7 /100 | #175 | Average 12.3% |
| Immigrants | Colombia | 47.7 /100 | #176 | Average 12.3% |
| Immigrants | Syria | 47.5 /100 | #177 | Average 12.3% |
| Uruguayans | 44.7 /100 | #178 | Average 12.4% |
| Immigrants | Morocco | 44.0 /100 | #179 | Average 12.4% |
| Mongolians | 43.6 /100 | #180 | Average 12.4% |
| Immigrants | Afghanistan | 42.1 /100 | #181 | Average 12.4% |