Immigrants from Portugal vs Costa Rican Poverty
COMPARE
Immigrants from Portugal
Costa Rican
Poverty
Poverty Comparison
Immigrants from Portugal
Costa Ricans
12.3%
POVERTY
50.5/ 100
METRIC RATING
172nd/ 347
METRIC RANK
12.2%
POVERTY
62.2/ 100
METRIC RATING
157th/ 347
METRIC RANK
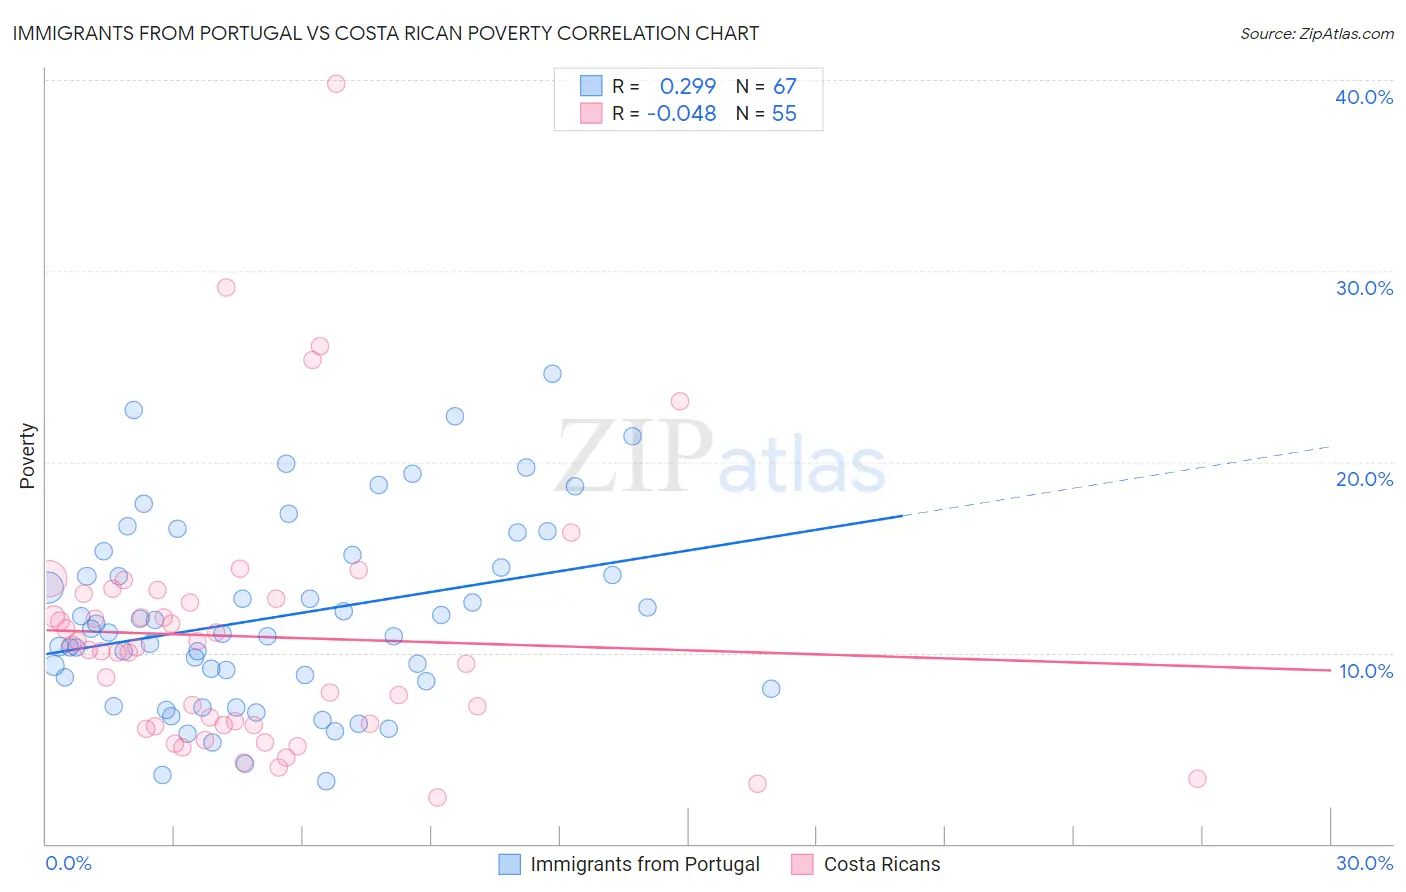
Immigrants from Portugal vs Costa Rican Poverty Correlation Chart
The statistical analysis conducted on geographies consisting of 174,738,655 people shows a weak positive correlation between the proportion of Immigrants from Portugal and poverty level in the United States with a correlation coefficient (R) of 0.299 and weighted average of 12.3%. Similarly, the statistical analysis conducted on geographies consisting of 253,487,550 people shows no correlation between the proportion of Costa Ricans and poverty level in the United States with a correlation coefficient (R) of -0.048 and weighted average of 12.2%, a difference of 1.2%.
Poverty Correlation Summary
| Measurement | Immigrants from Portugal | Costa Rican |
| Minimum | 3.3% | 2.4% |
| Maximum | 24.6% | 39.8% |
| Range | 21.3% | 37.4% |
| Mean | 11.9% | 10.8% |
| Median | 11.0% | 10.2% |
| Interquartile 25% (IQ1) | 8.5% | 6.2% |
| Interquartile 75% (IQ3) | 15.1% | 12.8% |
| Interquartile Range (IQR) | 6.6% | 6.6% |
| Standard Deviation (Sample) | 4.9% | 6.9% |
| Standard Deviation (Population) | 4.9% | 6.8% |
Demographics Similar to Immigrants from Portugal and Costa Ricans by Poverty
In terms of poverty, the demographic groups most similar to Immigrants from Portugal are Celtic (12.3%, a difference of 0.040%), Lebanese (12.3%, a difference of 0.050%), Immigrants from Spain (12.3%, a difference of 0.070%), Immigrants from Oceania (12.3%, a difference of 0.40%), and White/Caucasian (12.3%, a difference of 0.47%). Similarly, the demographic groups most similar to Costa Ricans are Scotch-Irish (12.2%, a difference of 0.040%), Taiwanese (12.2%, a difference of 0.040%), Pennsylvania German (12.2%, a difference of 0.14%), Hungarian (12.2%, a difference of 0.15%), and Guamanian/Chamorro (12.1%, a difference of 0.18%).
| Demographics | Rating | Rank | Poverty |
| Guamanians/Chamorros | 63.9 /100 | #154 | Good 12.1% |
| Hungarians | 63.6 /100 | #155 | Good 12.2% |
| Scotch-Irish | 62.6 /100 | #156 | Good 12.2% |
| Costa Ricans | 62.2 /100 | #157 | Good 12.2% |
| Taiwanese | 61.8 /100 | #158 | Good 12.2% |
| Pennsylvania Germans | 60.8 /100 | #159 | Good 12.2% |
| Immigrants | Nepal | 60.4 /100 | #160 | Good 12.2% |
| Immigrants | Fiji | 59.1 /100 | #161 | Average 12.2% |
| Ethiopians | 59.1 /100 | #162 | Average 12.2% |
| Immigrants | Ethiopia | 58.6 /100 | #163 | Average 12.2% |
| Colombians | 57.8 /100 | #164 | Average 12.2% |
| Immigrants | Albania | 57.7 /100 | #165 | Average 12.2% |
| Venezuelans | 56.9 /100 | #166 | Average 12.2% |
| Immigrants | Chile | 56.7 /100 | #167 | Average 12.2% |
| Immigrants | Venezuela | 56.5 /100 | #168 | Average 12.2% |
| Whites/Caucasians | 55.4 /100 | #169 | Average 12.3% |
| Immigrants | Oceania | 54.6 /100 | #170 | Average 12.3% |
| Immigrants | Spain | 51.3 /100 | #171 | Average 12.3% |
| Immigrants | Portugal | 50.5 /100 | #172 | Average 12.3% |
| Celtics | 50.1 /100 | #173 | Average 12.3% |
| Lebanese | 50.0 /100 | #174 | Average 12.3% |